Field Notes
<--2017-09-06 09:30:00 | 2017-10-04 09:40:00-->Other sites visited today: Bouldin Corn | Twitchell Alfalfa
Phenocam link: Searching...
Bouldin Alfalfa: 2017-09-19 11:00:00 (DOY 262)
Author: Daphne Szutu
Others: Sam Chamberlain
Summary: Regular data collection/cleaning, clip plots, veg height, LAI, swapped 7500 for calibration
| 2017-09-19 Bouldin Alfalfa We arrived at 11:00. It was sunny and breezy with some thin coulds. Sam did clip plots and veg height. I collected met, camera, and USB GHG data. I cleaned the radiation sensors. I also swapped 7500A: sn 0073 came down, sn 0042 went up. I uploaded a new configuration file, "sn0042_0674_20170918Lab_cal.l7x" and updated pressure coefficients. LI-7550 is running v8.0.0 so I left it as is. LI-7500 readings: CO2 377.4 --> 399.5 after swap H2O 505.6 --> 470 after swap T 21.7 --> 23.1 after swap P 101.7 --> 101.7 after swap SS 94.8--> 97.4 after swap I took 1-wand LAI readings walking N from the tower. "BA0919-1" is in my shadow. "BA0919-2" is in the sun. For both transects, LAI ~ 0.95, so it doesn't seem my shadow makes a big difference in measurement protocol. I tried to get representative samples of row and inter-row measurements. We left at 11:40. |
Next Mowing: 2017-09-29
Veg Height (cm): Tape measure from ground to top of plant
33, 45, 30, 31, 28, 34, 27, 31, 19, 26, 25, 27, 28, 36, 31, 34, 24, 32, 26, 36, avg = 30.2, stdev = 5.55
1 photos found

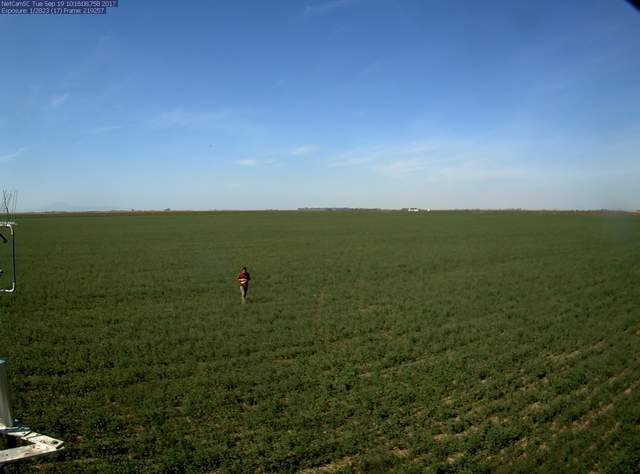
bouldinalfalfa_2017_09_19_101608.jpg ( 2017-09-19 09:25:38 ) Full size: 1296x960
Fieldwork
7 sets found
5 BA_flux graphs found
21 BA_met graphs found
No data found for BA_arable.
Can't check TATWBABCSB_cam
Can't check MBSWEEWPBCBA
2 BA_processed graphs found
No data found for BA_adex.

