
Field Notes
<--2017-08-25 10:48:00 | 2017-09-14 09:30:00-->Other sites visited today: Vaira
Phenocam link: Searching...
Tonzi: 2017-09-07 12:00:00 (DOY 250)
Author: Daphne Szutu
Others: Dennis, Siyan, Joe
Summary: Regular data collection, many brown trees, updated tower met CR1000 program, brought new pressure bomb compressed gas cylinder
| 2017-09-07 Tonzi We arrived at 12:00. It was warm and sunny, with some clouds. Some of the trees were completely brown. Dennis collected soil moisture measurements. Siyan did her usual field work and took water potential (pressure bomb) measurements. Joe brought a full compressed gas cylinder ("Breathing Air") for pressure bomb measurements. Siyan also reset a number of the dendrometers that were maxing out. Joe fixed the broken dendrometer on tree #102 the current circumference is 80.2cm. The dendrometer on Tree C6 is broken - its current circumference is 38.7cm. On the tower, I downloaded tower met, tower GHG, and phenocam CF card data. I also collected floor GHG and soil CO2 data. Joe collected the 2 tables from the floor met datalogger. I downloaded the zcam data to the black field laptop. I updated the program for tower met to v20170907 to fix some radiation data that were reading noise ~0. I updated the DifChan parameter for the difPAR and LED instructions, and the numbers look more reasonable now. difPAR and totPAR were also reversed, so I changed their order in the program. PAR channels had some NAN gaps; I tightened the screws and moved PARin to channel 25. Joe set up a tree NDVI out field-stop sensor sn 943203017 near the floor met data logger using cable ties and wired and programmed the sensor to the floor met data logger. We left at 14:30. |
Field Data
No tank data
Well Depth
| Date | Location | Depth (feet) |
|---|---|---|
| 2017-09-07 | TZ_floor | 23.8 |
| 2017-09-07 | TZ_road | 33.2 |
| 2017-09-07 | TZ_tower | 28.7 |
| 2017-09-07 | VR_pond | 14.3 |
mode = both
Moisture Point Probes TZ
Array
(
[0] => Tower_1
[1] => Floor_South_1
[2] => Floor_East_1
[3] => Floor_West_1
[4] => Soil_Transect_4_1
[5] => Soil_Transect_2_1
[6] => SoilCO2_West_A_1
[7] => SoilCO2_West_B_1
[8] => SoilCO2_West_C_1
[9] => Tower_2
[10] => Floor_South_2
[11] => Floor_East_2
[12] => Floor_West_2
[13] => Soil_Transect_4_2
[14] => Soil_Transect_2_2
[15] => SoilCO2_West_A_2
[16] => SoilCO2_West_B_2
[17] => SoilCO2_West_C_2
[18] => Tower_3
[19] => Floor_South_3
[20] => Floor_East_3
[21] => Floor_West_3
[22] => Soil_Transect_4_3
[23] => Soil_Transect_2_3
[24] => SoilCO2_West_A_3
[25] => SoilCO2_West_B_3
[26] => SoilCO2_West_C_3
[27] => Tower_4
[28] => Floor_South_4
[29] => Floor_East_4
[30] => Floor_West_4
[31] => Soil_Transect_4_4
[32] => Soil_Transect_2_4
[33] => SoilCO2_West_A_4
[34] => SoilCO2_West_B_4
[35] => SoilCO2_West_C_4
)
| Date | DOY | Rep | Depth | Tower_1 |
Floor_South_1 |
Floor_East_1 |
Floor_West_1 |
Soil_Transect_4_1 |
Soil_Transect_2_1 |
SoilCO2_West_A_1 |
SoilCO2_West_B_1 |
SoilCO2_West_C_1 |
Tower_2 |
Floor_South_2 |
Floor_East_2 |
Floor_West_2 |
Soil_Transect_4_2 |
Soil_Transect_2_2 |
SoilCO2_West_A_2 |
SoilCO2_West_B_2 |
SoilCO2_West_C_2 |
Tower_3 |
Floor_South_3 |
Floor_East_3 |
Floor_West_3 |
Soil_Transect_4_3 |
Soil_Transect_2_3 |
SoilCO2_West_A_3 |
SoilCO2_West_B_3 |
SoilCO2_West_C_3 |
Tower_4 |
Floor_South_4 |
Floor_East_4 |
Floor_West_4 |
Soil_Transect_4_4 |
Soil_Transect_2_4 |
SoilCO2_West_A_4 |
SoilCO2_West_B_4 |
SoilCO2_West_C_4 |
Avg | Spacial Count |
Measurement Count |
|---|---|---|---|---|---|---|---|---|---|---|---|---|---|---|---|---|---|---|---|---|---|---|---|---|---|---|---|---|---|---|---|---|---|---|---|---|---|---|---|---|---|---|
| 2017-09-07 | 250 | 0 | nan | 2.1 | 3.7 | 6.2 | 10.4 | 1.3 | 3.6 | 4.2 | 5.6 | 2.9 | 13.3 | 12.1 | 9.7 | 7.5 | 8.4 | 12.4 | 9 | 0.3 | 11.8 | 15.4 | 8.4 | 15.1 | 12.9 | 9.2 | 16.5 | 17.8 | 16.2 | 14.3 | 17 | 3 | 15.3 | 20.2 | 11 | 28.5 | 17.9 | 14.5 | 25.9 | |||
| 2017-09-07 | 250 | 1 | nan | 2.4 | 3.7 | 6.2 | 3.9 | 1 | 3.3 | 4.2 | 5.6 | 4 | 13.6 | 12.7 | 10.6 | 3.2 | 8.7 | 12.1 | 7.8 | 0.6 | 12.4 | 15.6 | 8.5 | 14 | 13.7 | 9.2 | 16.8 | 17.8 | 15.9 | 14 | 16.5 | 3 | 14.8 | 17.6 | 11.3 | 28.8 | 17.8 | 1512.4 | 25.6 | |||
| 2017-09-07 | 250 | 2 | nan | 2.7 | 4.8 | 5.3 | 10.3 | 1.6 | 4.2 | 3.6 | 5.3 | 1 | 13.3 | 12.1 | 11.8 | 2.9 | 8.4 | 12.4 | 8.4 | 1.2 | 11.8 | 15.1 | 7.8 | 14 | 12.9 | 9.5 | 16.8 | 17.3 | 15.9 | 14.5 | 17 | 3.3 | 14.8 | 18.5 | 11.3 | 29.1 | 17.3 | 15 | 25.6 | |||
| 2017-09-07 | 250 | Avg | 0-15cm | 0 | 0 | |||||||||||||||||||||||||||||||||||||
| 2017-09-07 | 250 | Avg | 15-30cm | 0 | 0 | |||||||||||||||||||||||||||||||||||||
| 2017-09-07 | 250 | Avg | 30-45cm | 0 | 0 | |||||||||||||||||||||||||||||||||||||
| 2017-09-07 | 250 | Avg | 45-60cm | 0 | 0 |
mode = both
Moisture Point Probes VR
Array
(
[0] => Solar_Panels_1
[1] => Flux_Tower_1
[2] => Gate_1
[3] => Biomass_Cage_1
[4] => Solar_Panels_2
[5] => Flux_Tower_2
[6] => Gate_2
[7] => Biomass_Cage_2
[8] => Solar_Panels_3
[9] => Flux_Tower_3
[10] => Gate_3
[11] => Biomass_Cage_3
[12] => Solar_Panels_4
[13] => Flux_Tower_4
[14] => Gate_4
[15] => Biomass_Cage_4
)
| Date | DOY | Rep | Depth | Solar_Panels_1 |
Flux_Tower_1 |
Gate_1 |
Biomass_Cage_1 |
Solar_Panels_2 |
Flux_Tower_2 |
Gate_2 |
Biomass_Cage_2 |
Solar_Panels_3 |
Flux_Tower_3 |
Gate_3 |
Biomass_Cage_3 |
Solar_Panels_4 |
Flux_Tower_4 |
Gate_4 |
Biomass_Cage_4 |
Avg | Spacial Count |
Measurement Count |
|---|---|---|---|---|---|---|---|---|---|---|---|---|---|---|---|---|---|---|---|---|---|---|
| 2017-09-07 | 250 | 0 | nan | 3 | 1 | 1.8 | 3 | 10 | 6.3 | 5.1 | 3.5 | 15.1 | 3.9 | 9.8 | 15.4 | 29.4 | 15 | 12.8 | 18.8 | |||
| 2017-09-07 | 250 | 1 | nan | 0.4 | 2.1 | 1 | 6.6 | 4.8 | 3.9 | 3.9 | 9.8 | 15.1 | 14.8 | 12.2 | 18.5 | |||||||
| 2017-09-07 | 250 | 2 | nan | 7 | 1.5 | 1 | 5.4 | 5.7 | 3.5 | 5 | 9.8 | 15.1 | 14.8 | 11.9 | 18.2 | |||||||
| 2017-09-07 | 250 | Avg | 0-15cm | 0 | 0 | |||||||||||||||||
| 2017-09-07 | 250 | Avg | 15-30cm | 0 | 0 | |||||||||||||||||
| 2017-09-07 | 250 | Avg | 30-45cm | 0 | 0 | |||||||||||||||||
| 2017-09-07 | 250 | Avg | 45-60cm | 0 | 0 |
No TZ grass heigth found
No VR grass heigth found
Tree DBH
| Date | Tag# | Reading (mm) |
|---|---|---|
| 2017-09-07 | 1 | 25.6 |
| 2017-09-07 | 1 | 6.1 |
| 2017-09-07 | 102 | 5.2 |
| 2017-09-07 | 2 | 20.5 |
| 2017-09-07 | 245 | 23.9 |
| 2017-09-07 | 245 | 5.0 |
| 2017-09-07 | 3 | 23.5 |
| 2017-09-07 | 3 | 5.5 |
| 2017-09-07 | 4 | 6.3 |
| 2017-09-07 | 4 | 22.0 |
| 2017-09-07 | 5 | 22.1 |
| 2017-09-07 | 5 | 2.6 |
| 2017-09-07 | 7 | 17.7 |
| 2017-09-07 | 72 | 23.6 |
| 2017-09-07 | 72 | 5.2 |
| 2017-09-07 | 79 | 22.4 |
| 2017-09-07 | 79 | 5.3 |
| 2017-09-07 | 8 | 21.8 |
Water Potential - mode: raw
| Time | Species | Tree | readings (bar) | ||
|---|---|---|---|---|---|
| 2017-09-07 13:14:00 | OAK | 102 | -27 | -52 | -47 |
| 2017-09-07 13:14:00 | OAK | 35 | -47 | -48 | -40 |
| 2017-09-07 13:14:00 | OAK | 92 | -28 | -42 | -48 |
| 2017-09-07 13:44:00 | PINE | OLD | -2 | -16 | -21 |
| 2017-09-07 13:44:00 | PINE | YNG | -10 | -2 | -1 |
No TZ Grass Biomass data found
No TZ OakLeaves Biomass data found
No TZ PineNeedles Biomass data found
2 photos found
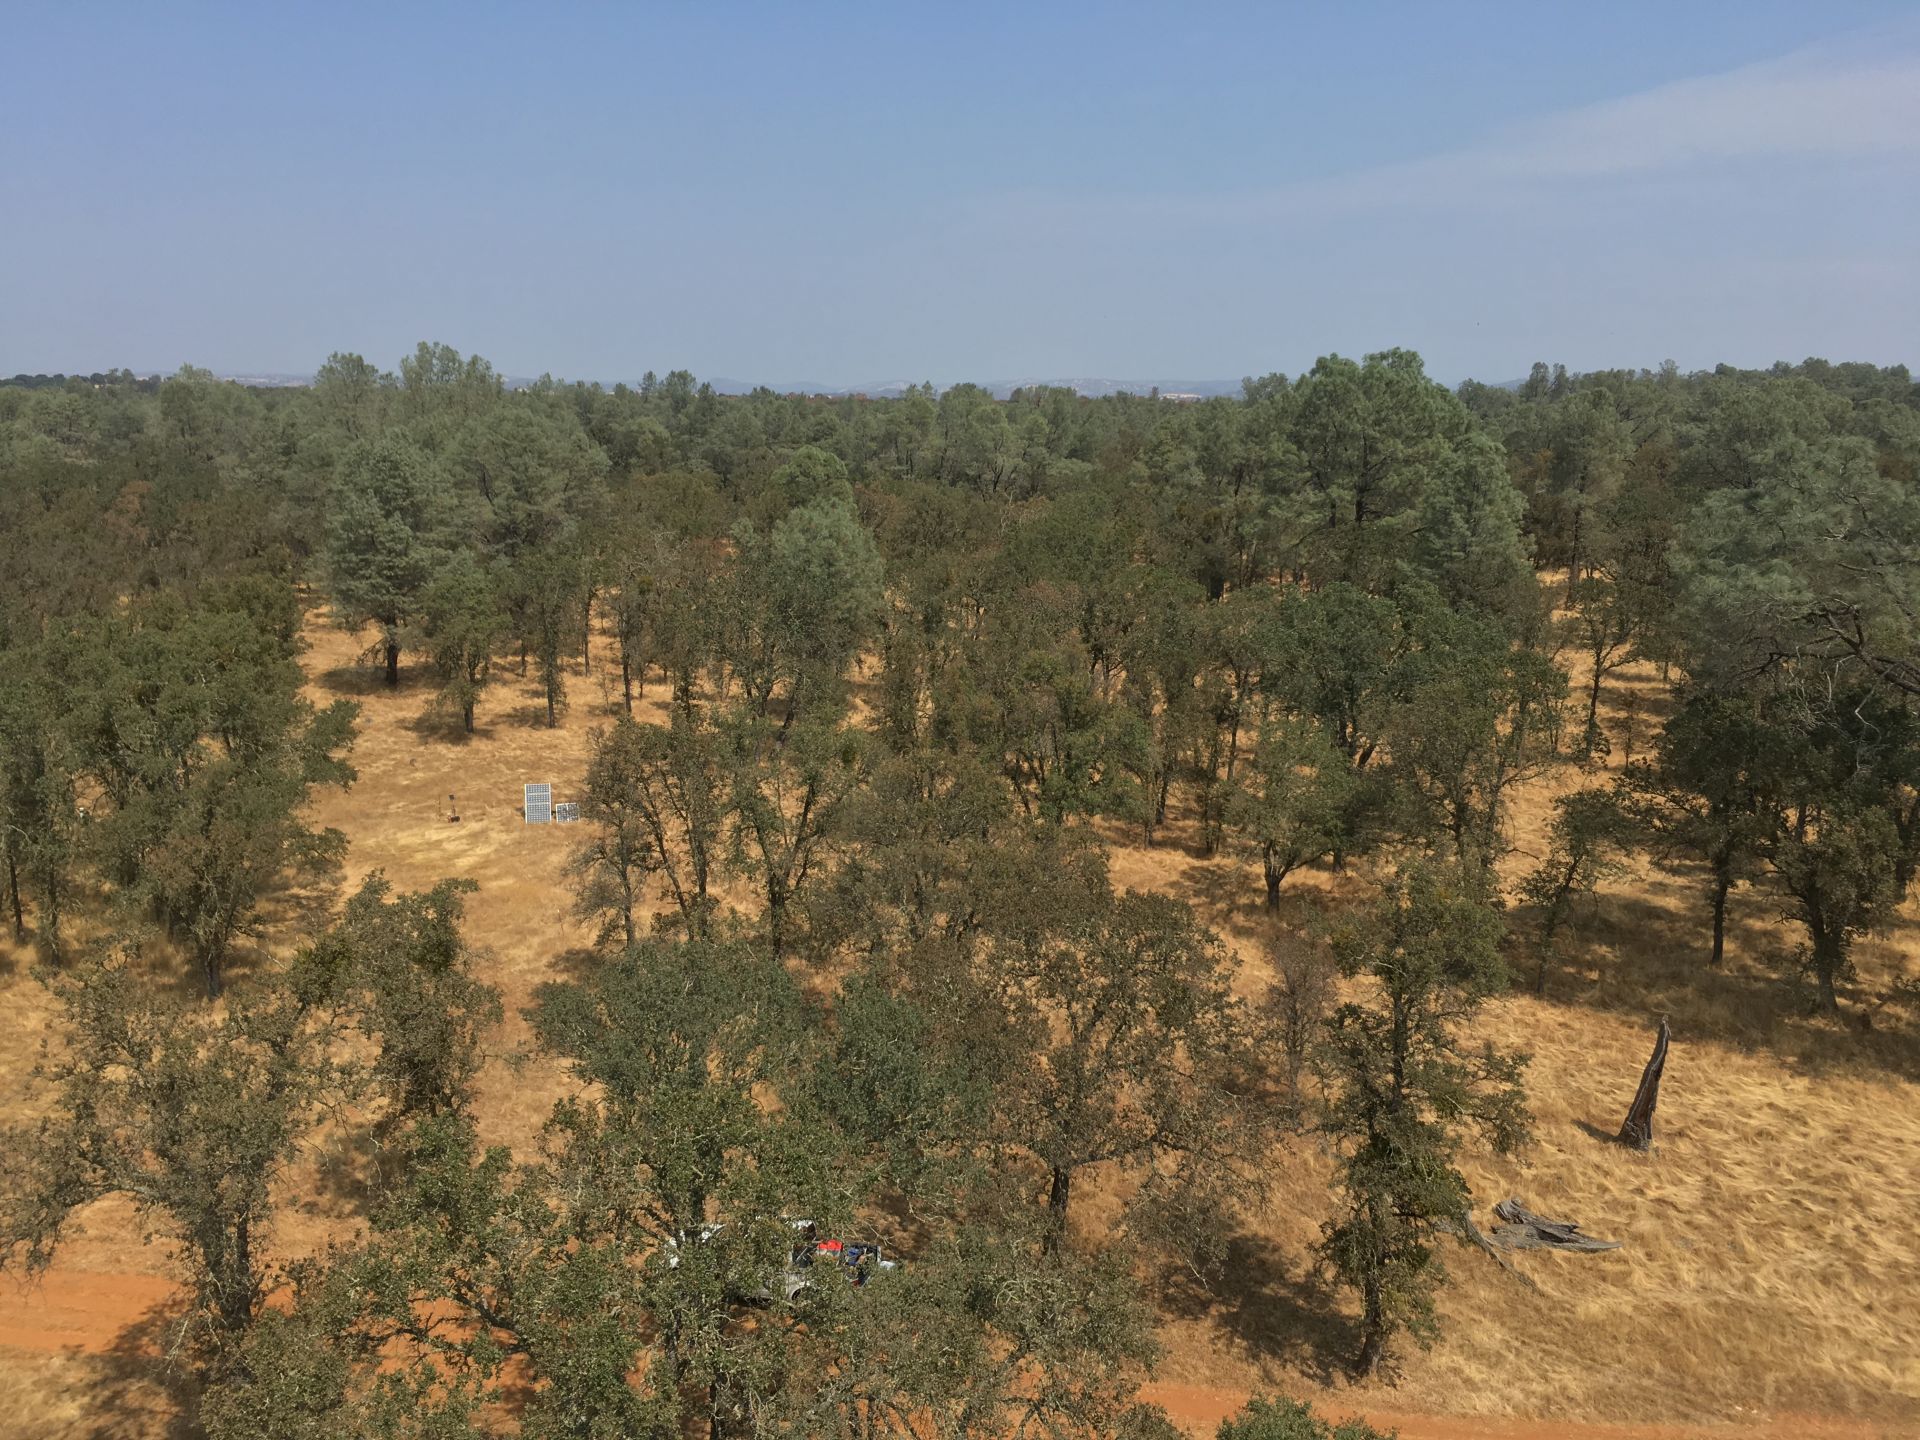
20170907TZ_north.JPG ( 2017-09-07 12:37:40 ) Full size: 1920x1440
View of Tonzi oak savanna, looking north from the tower, with mostly green oak/pine trees and bright yellow grass underneath
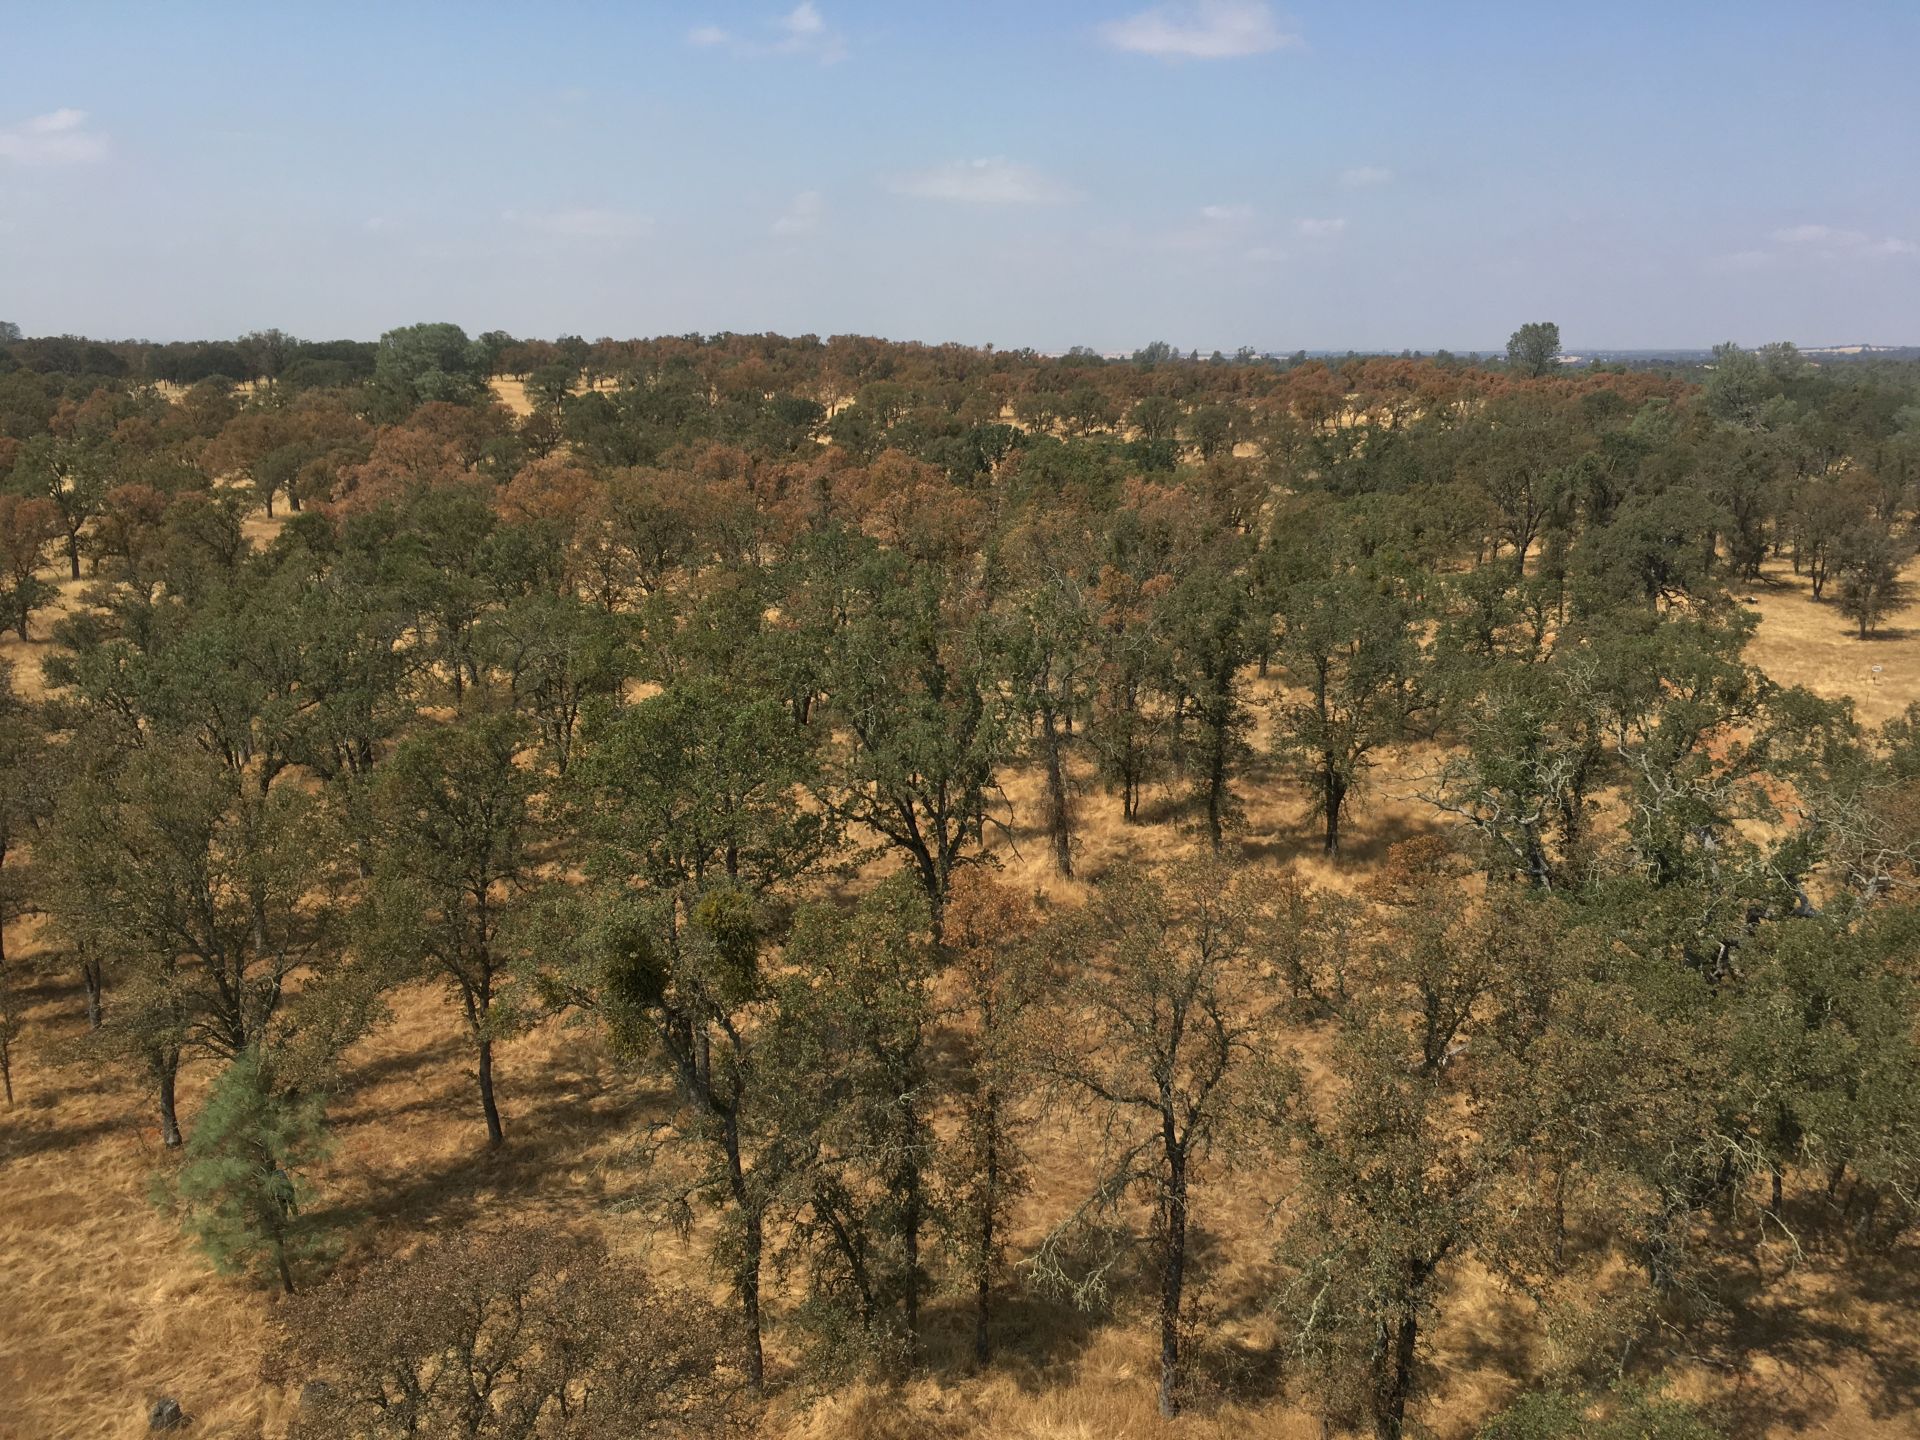
20170907TZ_west.JPG ( 2017-09-07 12:37:26 ) Full size: 1920x1440
View of Tonzi oak savanna, looking west from the tower. About a quarter of the visible oak/pine trees have brown canopies. The undercanopy is all bright yellow grass.
16 sets found
No data found for TZ_Fenergy.
11 TZ_tmet graphs found
11 TZ_soilco2 graphs found
Can't check TZ_mixed
3 TZ_mixed graphs found
1 TZ_fflux graphs found
8 TZ_fmet graphs found
No data found for TZ_tram.
No data found for TZ_co2prof.
1 TZ_irt graphs found
No data found for TZ_windprof.
1 TZ_tflux graphs found
2 TZ_sm graphs found
Can't check TZ_met
1 TZ_met graphs found
Can't check TZVR_mixed
No data found for TZ_osu.
No data found for TZ_fd.
Tonzi Z-cam data