
Field Notes
<--2017-06-28 09:45:00 | 2017-07-03 15:25:00-->Other sites visited today: Sherman Wetland
Phenocam link: Searching...
Sherman Wetland: 2017-06-28 10:00:00 (DOY 179)
Author: Patty Oikawa
Others: Max Burnham, Ankit Srinivas, Kyle Hemes, Joe Verfaillie, Mitch Craig, Niket Kundariya
Summary: Installed LGR, line power and added boardwalk near tower
| We arrived at the site and Kyle and Joe were already working on the boardwalk. They added a bit of boardwalk to the end near the tower to put the LGR box on. Meanwhile, Max Ankit and I unrolled 1000ft of 10 gauge electrical wire and cut into 2 500ft pieces. These were threaded through metal conduit, enough to protect the wire along the levee and ground. The conduit going across the levee was buried a couple of inches below the surface. The wire along the boardwalk out to the tower was not put in conduit, but the wire is heavy-duty and meant for outdoor use so it should be ok. *note-last 15 ft of wire along the levee were left exposed b/c we ran out of conduit--need to address this next time Joe connected the wiring up to power. Both lines worked. We carried the refrigerator-turned-LGR-box out to the end of the boardwalk and installed the LGR there (Carbon Dioxide Isotope Analyzer CCIA-38; model # 912-0003-0000-0000) . We installed the ACunit/heat pump in the box as well and set temp at 75F. The LGR turned on fine and specs looked normal. I hooked up the hotspot and remote access via team viewer appeared to be working well. We installed 1 inlet to the LGR from the top of the tower near the sonic. *note-I need to take measurements of inlet location next time We put a swagelok filter on the inlet to prevent bugs from being pulled into the LGR. Flow rates into the LGR were not measured, and need to be measured on the next visit to make sure flow is high enough for eddy covariance. Sample cell =200cc at 1 hz sampling rate meaning flow rates need to be ~12L/min. Meanwhile the Geology team from CSU EB, Mitch and Niket, ran a seismic line on the other side of the levee at SW and then moved to the alfalfa field near MB tower to run another line. LGR specs: gas temp=44.8C gas P=119.76 torr laser response time=12.9 micros CO2=401.88 ppm D13C=-4.05 per mil D18O= 60.75 per mil H2O=227.5ppm |
2 photos found
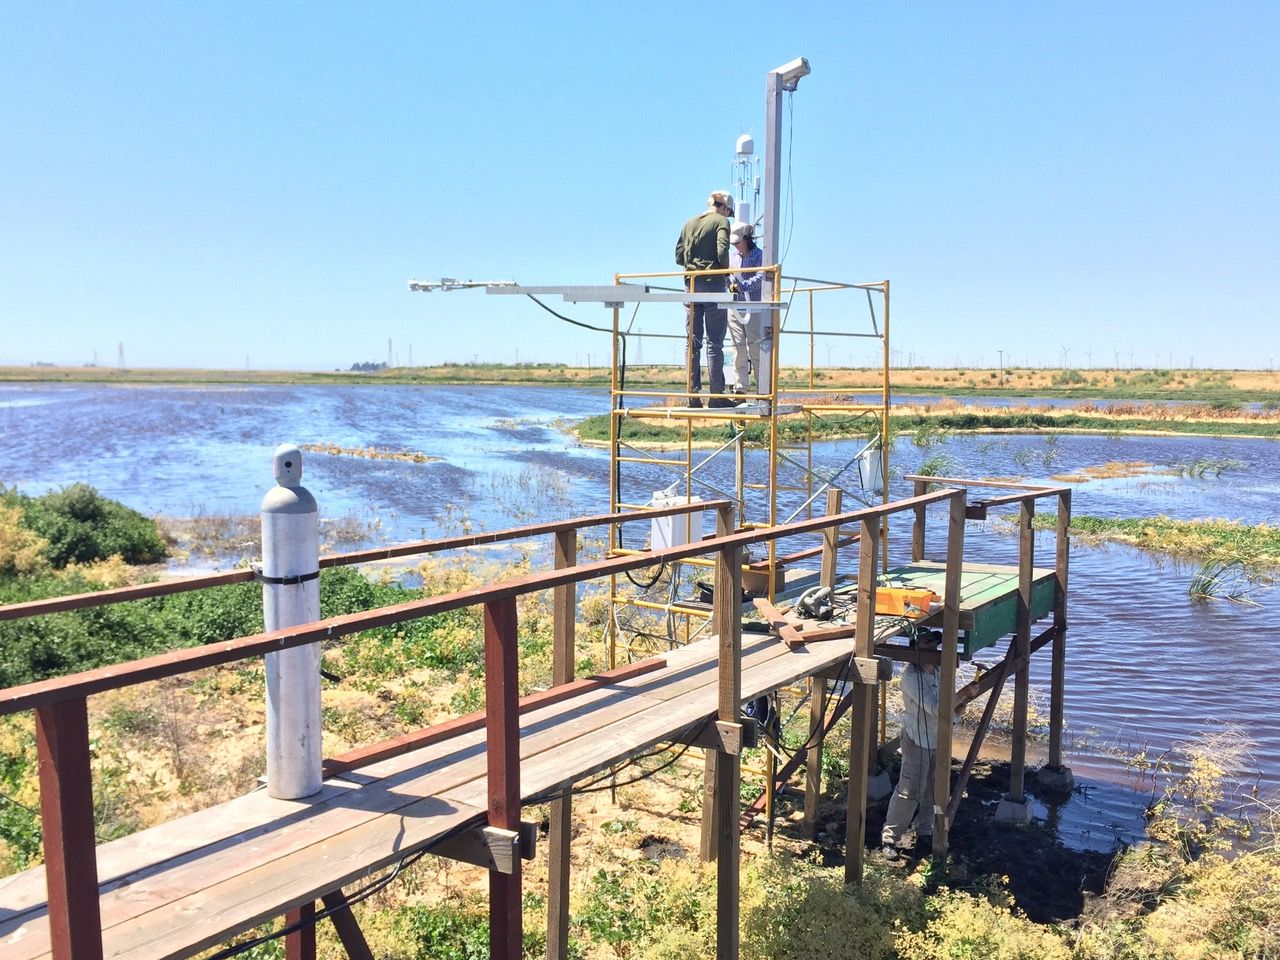
20170628SW_PattyMaxJoe.jpg ( 2017-06-28 14:54:55 ) Full size: 1280x960
Max, Patty, and Joe building a platform and installing the LGR isotope system
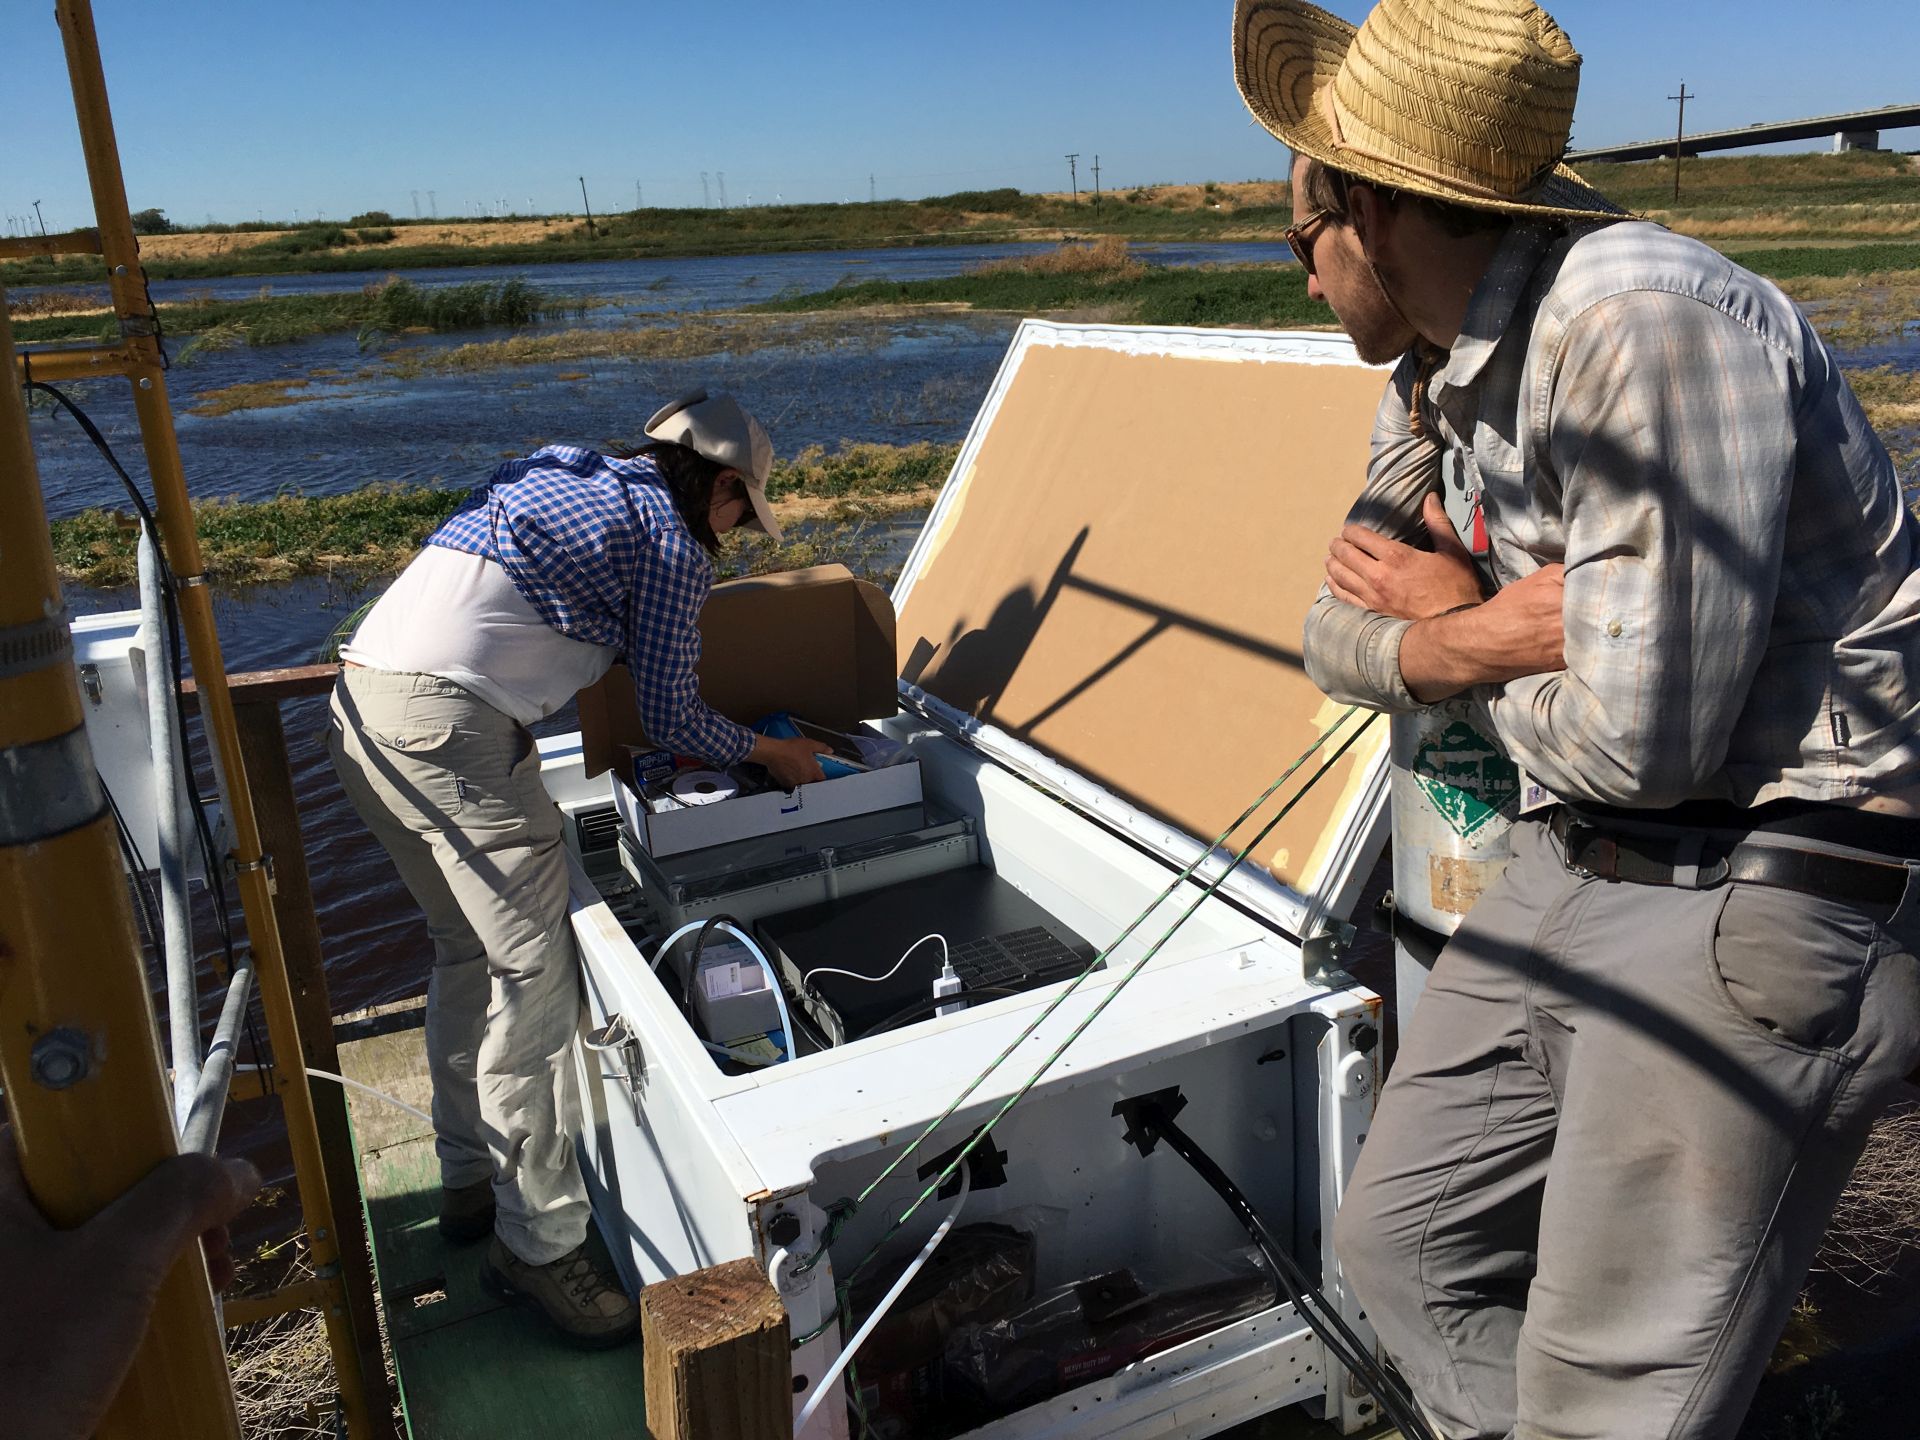
20170628SW_PattyKyleLGR.jpg ( 2017-06-28 16:24:08 ) Full size: 1920x1440
Patty and a windblown Kyle checking the newly installed LGR isotope system. The LGR analyzer is in an old refrigerator
7 sets found
Can't check MBWPEESWGT_mixed
Can't check MBEEWPSWEPGT_cam
15 SW_met graphs found
4 SW_flux graphs found
Can't check MBSWEEWPBCBA
Can't check SW_Temp
14 SW_Temp graphs found
No data found for SW_arable.