Field Notes
<--2017-06-05 12:55:00 | 2017-06-23 10:00:00-->Phenocam link: Searching...
East End: 2017-06-14 09:00:00 (DOY 165)
Author: Elke Eichelmann
Others: Joe Verfaillie, Ada Chang
Summary: Set up Closed Vegetation Temporary Tower, Moved met sensors at Open Water TT, swapped LI7500 at EE permanent tower
| Arrived around 9:00. It was a clear, sunny and hot day in the delta. There was a slight breeze above the canopy in the wetland, but no wind within the canopy. EE permanent tower: Ada and I stopped by the EE permanent tower between 10:20 and 11am to grab some mounting booms that we were going to use at the closed veg TT setup. We removed the two long horizontal booms and one vertical boom and fittings that were still there from the Ameriflux intercomparison. We also swapped the LI7500, sn 75H-2514 came down, sn 75H-2150 went up. We updated the config files, put in pressure coefficients and reset the LI7550 box to synchronize with the LI7700 again. Everything looked good after the swap. We did not collect any data nor did we look at the met data. We cleaned the LI7700, the wash reservoir was still full so we did not refill that. LI7500 readings: Before swap -> after swap CO2 426.6 umol/mol 421.6 H2O 689.9 mmol/m3 625.8 T 25.5 Celsius 25.99 P 101.38 kPa 101.40 SS 98.3 93.08 LI7700 readings: CH4: 2.04 RSSI: 56.2 -> 75.5 after cleaning Temporary Tower 2: Closed Vegetation site We set up the second temporary tower over the closed vegetation site today. We put in scaffolding at the edge of the wetland. The general tower setup is very similar to the other permanent towers we have. We have a full set of eddy instruments on there: WindMaster Pro sonic sn 153805 ; LI-7500 sn 75H-2176; LI-7700 sn TG1-0211; LI-7550 box sn AIU-0614; The set of met instruments consists of: 2 Heat flux plates, a water level sensor, 10 thermocouples at two profiles with five depth: Tsoil at 0cm and -5cm below ground level; Twater at 15cm, 30cm, and 45cm above ground level. The thermocouples were wired to the CR6/AM25T in the field starting with one set at -5cm at port 1H/L and going upwards along the profile (-5, 0, 15, 30, 45) and starting the second set at port 6H/L with the -5cm soil and going up along the profile again. There is also a net radiometer and a PAR sensor pointing out over the wetland. The spot where the Net Radiometer and the PAR sensor are pointing at is slightly less vegetated than the rest of the area, but the boom would not reach further. The PAR sensor is pointed downwards to measure outgoing PAR. An HMP60 is also connected to the met. It is placed within a shield but the fan on the aspirator is not connected to power yet, so that is not running. The height from water level to the middle of the sonic path is 3.88m. We forgot to measure the sonic boom angle. Need to do that next time. We also need to get longitude and latitude next time. The height from the water surface to the radiation sensors was approximately 2.86m. The water level was 46cm around the locations of the thermocouples and the water level sensor. We tested the LI7700 washing cycle (pump and spin motor) and both were working fine. LI7500 readings: CO2 400.5, H2O 603.0, SS 90.65, T 32.62, P 101.21 LI7700 readings: CH4: 1.99, RSSI: 71.5 Full equipment list: CR6 sn 2115 AM25T sn 4852 SHF#1 sn 6499 SHF#2 sn 10809 Water pressure sn 70011236 HMP45 sn U3030046 Gill WM sn 153805 LI7700 sn TG1-0211 LI7500 sn 75H-2176 LI7550 sn AIU-0614 Rnet-Lite sn 021029 14.1uV/(W/m2) PAR sn 050597 5.35uV/(umol/m2/s) Solar panel sn 11ZV0M0829 Solar panel sn 11ZV0M0828 Solar controller sn 22678-0999 Temporary Tower 1: Open Water site Joe went out to the Open Water TT while Ada and I were working on setting up the Closed Veg TT. Joe moved the met box and instruments to a post further out in the wetland, on the edge of the open water pond. The Water/Soil thermocouples, heat flux plates, and radiation measurements were moved to that location. The HMP air temp and humidity probe was left with the eddy instruments. After we were done at the closed veg site I went out to the new met location in the open water site and helped put in the thermocouples. Because the TC were taped a little awkwardly and the water is so much deeper here, the profiles were inverted. For each profile, the TC that was originally on top (35cm) is now a few cm in the soil. It was really hard to judge how far the TC are in the soil since the water is so deep and you can’t get your hands down there. The new profiles are now approximately: -5cm, 5cm, 15cm, 30cm, 35cm and wired going from top down on the multiplexer. The water level was approximately 1m varying between 95cm and 120cm across the edge of the pond. The pond gets deeper the further in you go but the waders have a limit… We should probably retape the thermocouples to something that makes more sense in the new location. The radiation sensors are mounted at 2.50m above the water surface. LI7500 readings: CO2 396.67ppm H2O 710.8mmol/m3 SS 105 after cleaning T 30.5C P 101.7kPa LI7700 readings: CH4: 2.02ppm RSSI: 41.2 -> 76 after cleaning Left at 3:30pm |
5 photos found
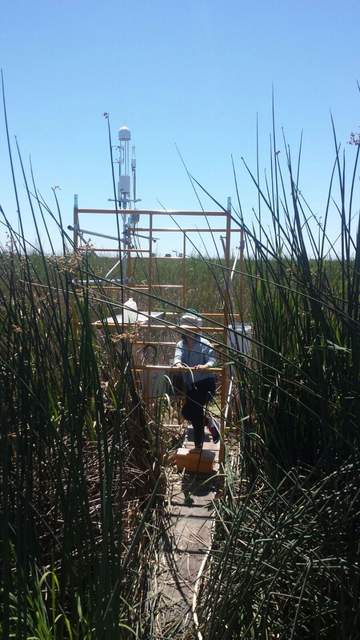
20170614EE_ClosedVegTower.jpg ( 2017-06-14 00:00:00 ) Full size: 810x1440
Temporary Tower set up on Twitchell Island near the East End Tower. This tower is measuring a closed vegetation area.
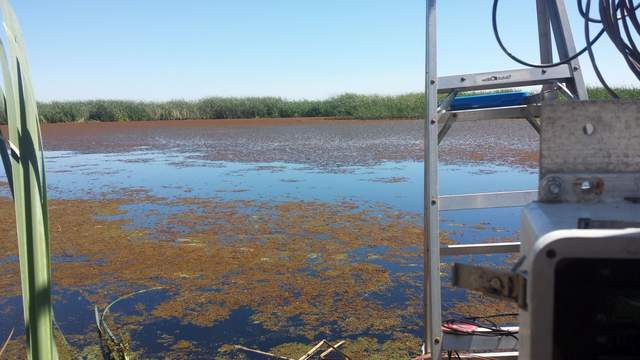
20170614EE_OpenWaterMet2.jpg ( 2017-06-14 15:20:09 ) Full size: 1920x1080
One of the temporary towers is set up to measure open water. While the EC instruments are on the road, the met sensors are right next to or in the water.
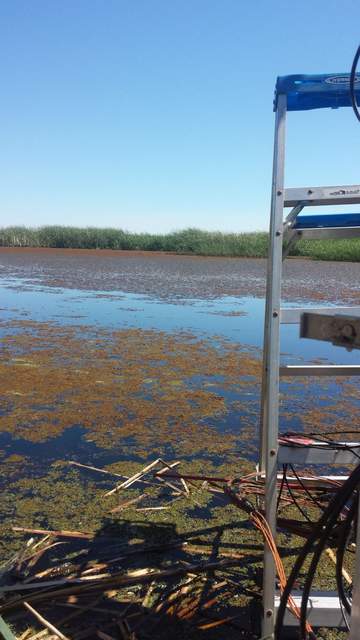
20170614EE_OpenWaterMet1.jpg ( 2017-06-14 15:20:02 ) Full size: 810x1440
One of the temporary towers is set up to measure open water. While the EC instruments are on the road, the met sensors are right next to or in the water.
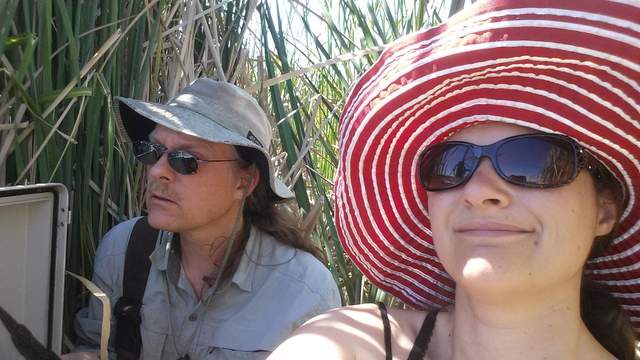
20170614EE_JVEEselfie.jpg ( 2017-06-14 15:20:55 ) Full size: 1920x1080
Joe and Elke on site
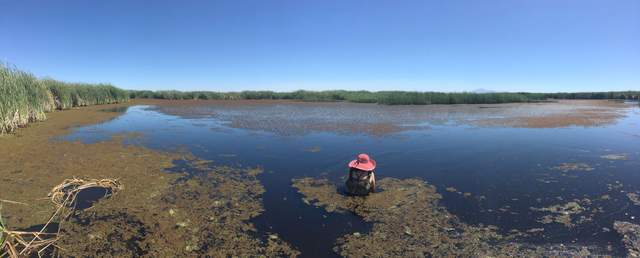
20170614EE_Temp1_OpenWater.jpg ( 2017-06-14 15:28:58 ) Full size: 1920x774
Elke in the water installing thermocouples at our East End open water temporary tower site
11 sets found
14 EE_met graphs found
Can't check EE_mixed
1 EE_mixed graphs found
8 EE_flux graphs found
Can't check MBWPEESWGT_mixed
1 EE_cam graphs found
Can't check MBEEWPSWEPGT_cam
Can't check SIMBTWEE_met
Can't check EE_Temp
5 EE_Temp graphs found
Can't check EE_minidot
1 EE_minidot graphs found
Can't check MBSWEEWPBCBA
1 EE_processed graphs found

