
Field Notes
<--2017-04-11 13:15:00 | 2017-05-10 14:25:00-->Other sites visited today: Bouldin Corn | Bouldin Alfalfa | Sherman Wetland | West Pond | East End | Twitchell Alfalfa
Phenocam link: Searching...
Mayberry: 2017-04-27 12:30:00 (DOY 117)
Author: Daphne Szutu
Others: Sam Chamberlain
Summary: Data collection/cleaning, swapped 7500, water level is low
| 2017-04-27 Mayberry We arrived at 12:30. It was sunny, mostly clear, and breezy. They've mowed the road between the levee and the tower path. The path to the tower still has tall grass. The wetland is greening up. The water level is low; the water level was up to Sam's knees. The top minidot/eos CO2 probe were out of the water. The HOBO conductivity probe was also out of the water so Sam lowered the sensor. He also lowered the fluorometer to lowest point possible and tilted it under water to try to get air bubbles out. We cleaned the flux and radiation sensors. I collected the USB GHG and camera data. I forgot to bring the CS I/O cable, so I did not download the met data. I swapped the LI-7500: sn 1594 came down, sn 75H-2180 went up. LI7500 readings: CO2 410.4 umol/mol --> 418 after swap H2O 512.1 mmol/m3 --> 432 after swap T 19.7 Celsius --> 20.4 after swap P 101.6 kPa --> 101.5 after swap SS 100.7 -> 95 after swap LI7700 readings: CH4: 1.92 RSSI: 42.0 -> 69 after cleaning We left at 13:15. |
1 photos found
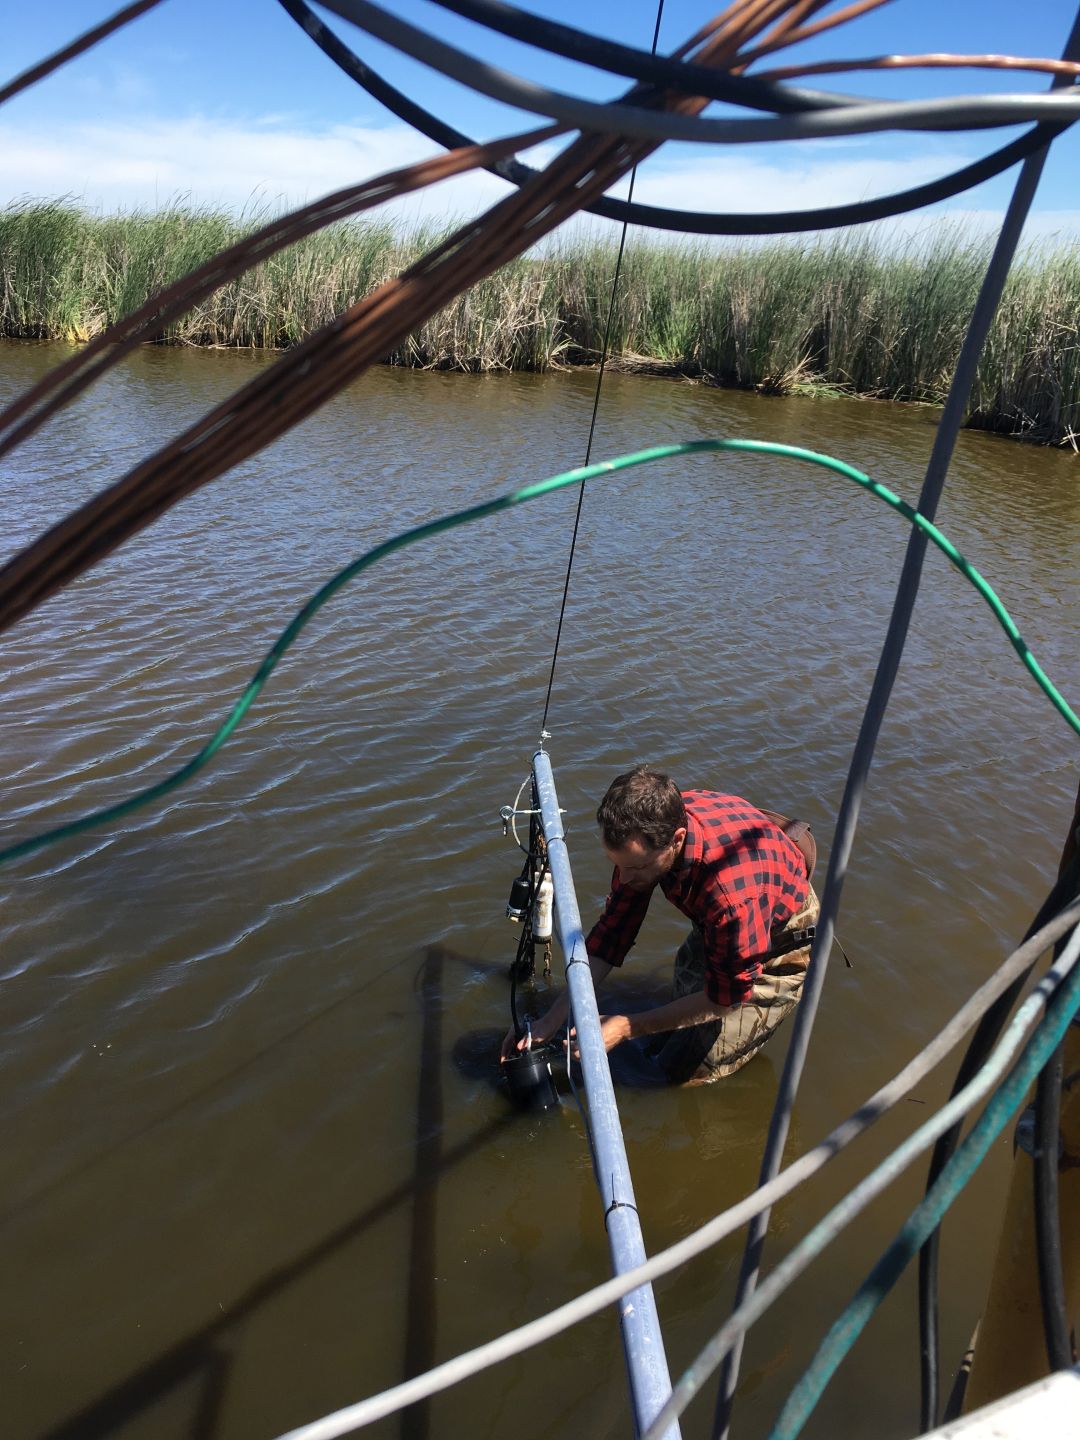
20170427MB_lowwaterlevel.JPG ( 2017-04-27 12:44:05 ) Full size: 1080x1440
Low water level at Mayberry as Bryan is draining and then refilling to correct for high salinity. Sam is getting air bubbles out of the fluorometer.
11 sets found
7 MB_flux graphs found
No data found for MB_met.
28 MB_tule graphs found
Can't check MBWPEESWGT_mixed
1 MB_cam graphs found
Can't check MBEEWPSWEPGT_cam
Can't check SIMBTWEE_met
1 MB_minidot graphs found
Can't check MBSWEEWPBCBA
1 MB_processed graphs found
Can't check MB_fd
1 MB_fd graphs found