
Field Notes
<--2016-05-10 10:30:00 | 2016-05-26 11:00:00-->Other sites visited today: Tonzi
Phenocam link: Searching...
Tonzi: 2016-05-10 10:30:00 (DOY 131)
Author: Siyan Ma
Others: Joe, Elke
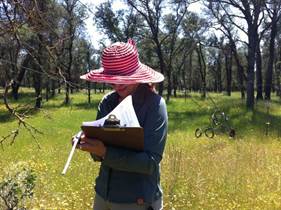
Summary: Swapped 7500s, standard field work, started tree survey, midday water potential, grasses seeding
|
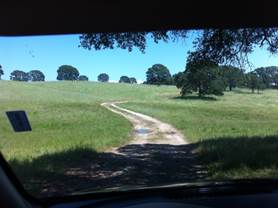
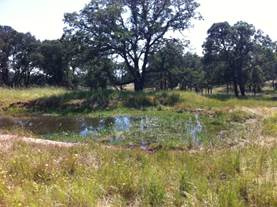
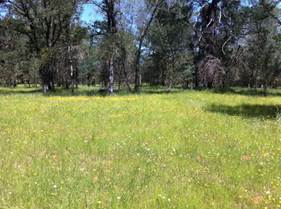
When: Date: 5/10/2016 , Day: 131 , Watch Time: 10:30 am . Where: Tonzi/Vaira Ranch Who: Siyan, Joe, Elke Weather: clear, sunny Phenology: grasses are in the filling stage; oak leaves looked larger and darker than previous years; more dead branches and twigs; two trees around the tower were dead.
Summary
Vaira_Grass Site
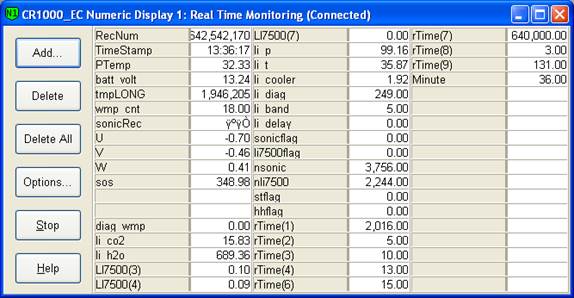
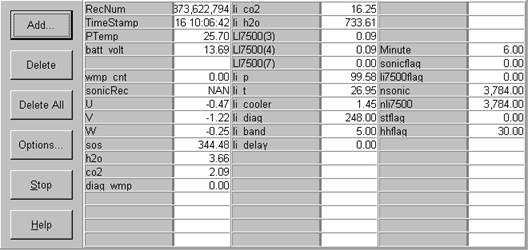
Tonzi_Tower Site
10. closed gate and set up fence. YES! Toniz_Floor Site
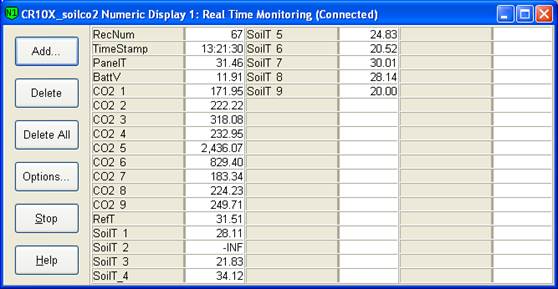
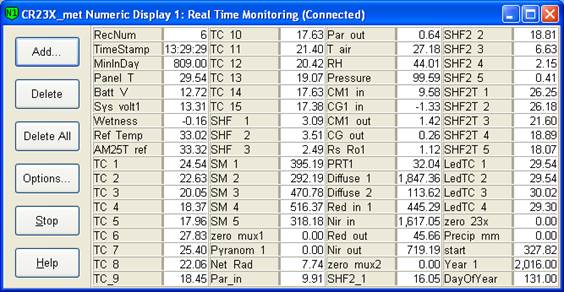
CR23X3 – floor-Met CR23X6 – tower-Met CR10X2 – floor-Met Soil CO2 profile: CR23X5 – soil CO2 profile
5. Closed gate and set up fence. YES! |
Field Data
No tank data
Well Depth
| Date | Location | Depth (feet) |
|---|---|---|
| 2016-05-10 | TZ_floor | 23.1 |
| 2016-05-10 | TZ_road | 31.5 |
| 2016-05-10 | TZ_tower | 26.7 |
mode = both
Moisture Point Probes TZ
Array
(
[0] => Tower_1
[1] => Floor_South_1
[2] => Floor_East_1
[3] => Floor_West_1
[4] => SoilCO2_1
[5] => Soil_Transect_4_1
[6] => Soil_Transect_3_1
[7] => Soil_Transect_2_1
[8] => Soil_Transect_1_1
[9] => SoilCO2_West_A_1
[10] => SoilCO2_West_B_1
[11] => SoilCO2_West_C_1
[12] => Tower_2
[13] => Floor_South_2
[14] => Floor_East_2
[15] => Floor_West_2
[16] => SoilCO2_2
[17] => Soil_Transect_4_2
[18] => Soil_Transect_3_2
[19] => Soil_Transect_2_2
[20] => Soil_Transect_1_2
[21] => SoilCO2_West_A_2
[22] => SoilCO2_West_B_2
[23] => SoilCO2_West_C_2
[24] => Tower_3
[25] => Floor_South_3
[26] => Floor_East_3
[27] => Floor_West_3
[28] => SoilCO2_3
[29] => Soil_Transect_4_3
[30] => Soil_Transect_3_3
[31] => Soil_Transect_2_3
[32] => Soil_Transect_1_3
[33] => SoilCO2_West_A_3
[34] => SoilCO2_West_B_3
[35] => SoilCO2_West_C_3
[36] => Tower_4
[37] => Floor_South_4
[38] => Floor_East_4
[39] => Floor_West_4
[40] => SoilCO2_4
[41] => Soil_Transect_4_4
[42] => Soil_Transect_3_4
[43] => Soil_Transect_2_4
[44] => Soil_Transect_1_4
[45] => SoilCO2_West_A_4
[46] => SoilCO2_West_B_4
[47] => SoilCO2_West_C_4
)
| Date | DOY | Rep | Depth | Tower_1 |
Floor_South_1 |
Floor_East_1 |
Floor_West_1 |
SoilCO2_1 |
Soil_Transect_4_1 |
Soil_Transect_3_1 |
Soil_Transect_2_1 |
Soil_Transect_1_1 |
SoilCO2_West_A_1 |
SoilCO2_West_B_1 |
SoilCO2_West_C_1 |
Tower_2 |
Floor_South_2 |
Floor_East_2 |
Floor_West_2 |
SoilCO2_2 |
Soil_Transect_4_2 |
Soil_Transect_3_2 |
Soil_Transect_2_2 |
Soil_Transect_1_2 |
SoilCO2_West_A_2 |
SoilCO2_West_B_2 |
SoilCO2_West_C_2 |
Tower_3 |
Floor_South_3 |
Floor_East_3 |
Floor_West_3 |
SoilCO2_3 |
Soil_Transect_4_3 |
Soil_Transect_3_3 |
Soil_Transect_2_3 |
Soil_Transect_1_3 |
SoilCO2_West_A_3 |
SoilCO2_West_B_3 |
SoilCO2_West_C_3 |
Tower_4 |
Floor_South_4 |
Floor_East_4 |
Floor_West_4 |
SoilCO2_4 |
Soil_Transect_4_4 |
Soil_Transect_3_4 |
Soil_Transect_2_4 |
Soil_Transect_1_4 |
SoilCO2_West_A_4 |
SoilCO2_West_B_4 |
SoilCO2_West_C_4 |
Avg | Spacial Count |
Measurement Count |
|---|---|---|---|---|---|---|---|---|---|---|---|---|---|---|---|---|---|---|---|---|---|---|---|---|---|---|---|---|---|---|---|---|---|---|---|---|---|---|---|---|---|---|---|---|---|---|---|---|---|---|---|---|---|---|
| 2016-05-10 | 131 | 0 | nan | 11.2 | 10 | 39.9 | 11.1 | 19.1 | 17.9 | 5.9 | 14.7 | 12.4 | 23.5 | 12.4 | 17.3 | 17.9 | 21.9 | 28.6 | 17 | 19.7 | 17.3 | 23.4 | 24.6 | 9.3 | 10.3 | 10.6 | 23.7 | 23.7 | 26.5 | 34.9 | 27.8 | 35.2 | 17 | 22.6 | 27.9 | 23.5 | 30.4 | 27.6 | 17.9 | 21.3 | 36.5 | 54 | 40.5 | 35.4 | 22.5 | 33.7 | 44 | 18.8 | 40.5 | 43.4 | 46.8 | |||
| 2016-05-10 | 131 | 1 | nan | 11.2 | 10.6 | 39.9 | 11.1 | 19.7 | 18.8 | 8.8 | 14.7 | 13.2 | 23.2 | 13 | 17.3 | 17.6 | 22.8 | 28.3 | 19.1 | 19.7 | 173 | 23.7 | 24.9 | 9.7 | 20.3 | 11.2 | 23.4 | 23.2 | 27.1 | 35.7 | 27.4 | 34.3 | 16.2 | 22.6 | 27.4 | 23.7 | 30.1 | 28.2 | 17 | 21.6 | 37.1 | 55.1 | 39.1 | 37.7 | 21.9 | 33.7 | 42.8 | 18.8 | 40.3 | 43.1 | 48.8 | |||
| 2016-05-10 | 131 | Avg | 0-15cm | 0 | 0 | |||||||||||||||||||||||||||||||||||||||||||||||||
| 2016-05-10 | 131 | Avg | 15-30cm | 0 | 0 | |||||||||||||||||||||||||||||||||||||||||||||||||
| 2016-05-10 | 131 | Avg | 30-45cm | 0 | 0 | |||||||||||||||||||||||||||||||||||||||||||||||||
| 2016-05-10 | 131 | Avg | 45-60cm | 0 | 0 |
mode = both
Moisture Point Probes VR
Array
(
[0] => Solar_Panels_1
[1] => Flux_Tower_1
[2] => Solar_Panels_2
[3] => Flux_Tower_2
[4] => Solar_Panels_3
[5] => Flux_Tower_3
[6] => Solar_Panels_4
[7] => Flux_Tower_4
)
| Date | DOY | Rep | Depth | Solar_Panels_1 |
Flux_Tower_1 |
Solar_Panels_2 |
Flux_Tower_2 |
Solar_Panels_3 |
Flux_Tower_3 |
Solar_Panels_4 |
Flux_Tower_4 |
Avg | Spacial Count |
Measurement Count |
|---|---|---|---|---|---|---|---|---|---|---|---|---|---|---|
| 2016-05-10 | 131 | 0 | nan | 10.3 | 8.3 | 16.7 | 13 | 19.3 | 8.1 | 31.4 | 18.5 | |||
| 2016-05-10 | 131 | 1 | nan | 8.6 | 8.6 | 16.7 | 12.7 | 19.5 | 8.1 | 31.1 | 18.2 | |||
| 2016-05-10 | 131 | Avg | 0-15cm | 0 | 0 | |||||||||
| 2016-05-10 | 131 | Avg | 15-30cm | 0 | 0 | |||||||||
| 2016-05-10 | 131 | Avg | 30-45cm | 0 | 0 | |||||||||
| 2016-05-10 | 131 | Avg | 45-60cm | 0 | 0 |
No TZ grass heigth found
Grass Height VR 16
| Date | Height reps (cm) | Location | Average | Samp | STDEV | |||||||||||||||
|---|---|---|---|---|---|---|---|---|---|---|---|---|---|---|---|---|---|---|---|---|
| 2016-05-10 | 82 | 65 | 96 | 66 | 62 | 71 | 88 | 54 | 58 | 67 | 24 | 56 | 99 | 92 | 41 | GH_ALL | 68.07 | 15 | 20.13 | |
Tree DBH
| Date | Tag# | Reading (mm) |
|---|---|---|
| 2016-05-10 | 1 | 22.7 |
| 2016-05-10 | 102 | 18.7 |
| 2016-05-10 | 2 | 18.3 |
| 2016-05-10 | 245 | 22.9 |
| 2016-05-10 | 3 | 21.5 |
| 2016-05-10 | 4 | 16.2 |
| 2016-05-10 | 5 | 17.3 |
| 2016-05-10 | 7 | 15.5 |
| 2016-05-10 | 72 | 23.2 |
| 2016-05-10 | 79 | 23.4 |
| 2016-05-10 | 8 | 18.6 |
Water Potential - mode: raw
| Time | Species | Tree | readings (bar) | ||
|---|---|---|---|---|---|
| 2016-05-10 00:00:00 | OAK | 102 | -11 | -7 | -8 |
| 2016-05-10 00:00:00 | OAK | 35 | -10 | -13 | -20 |
| 2016-05-10 00:00:00 | OAK | 92 | -22 | -25 | -26 |
| 2016-05-10 00:00:00 | PINE | OLD | -4 | -21 | -21 |
| 2016-05-10 00:00:00 | PINE | YNG | -2 | -5 | -7 |
No TZ Grass Biomass data found
No TZ OakLeaves Biomass data found
No TZ PineNeedles Biomass data found
2 photos found
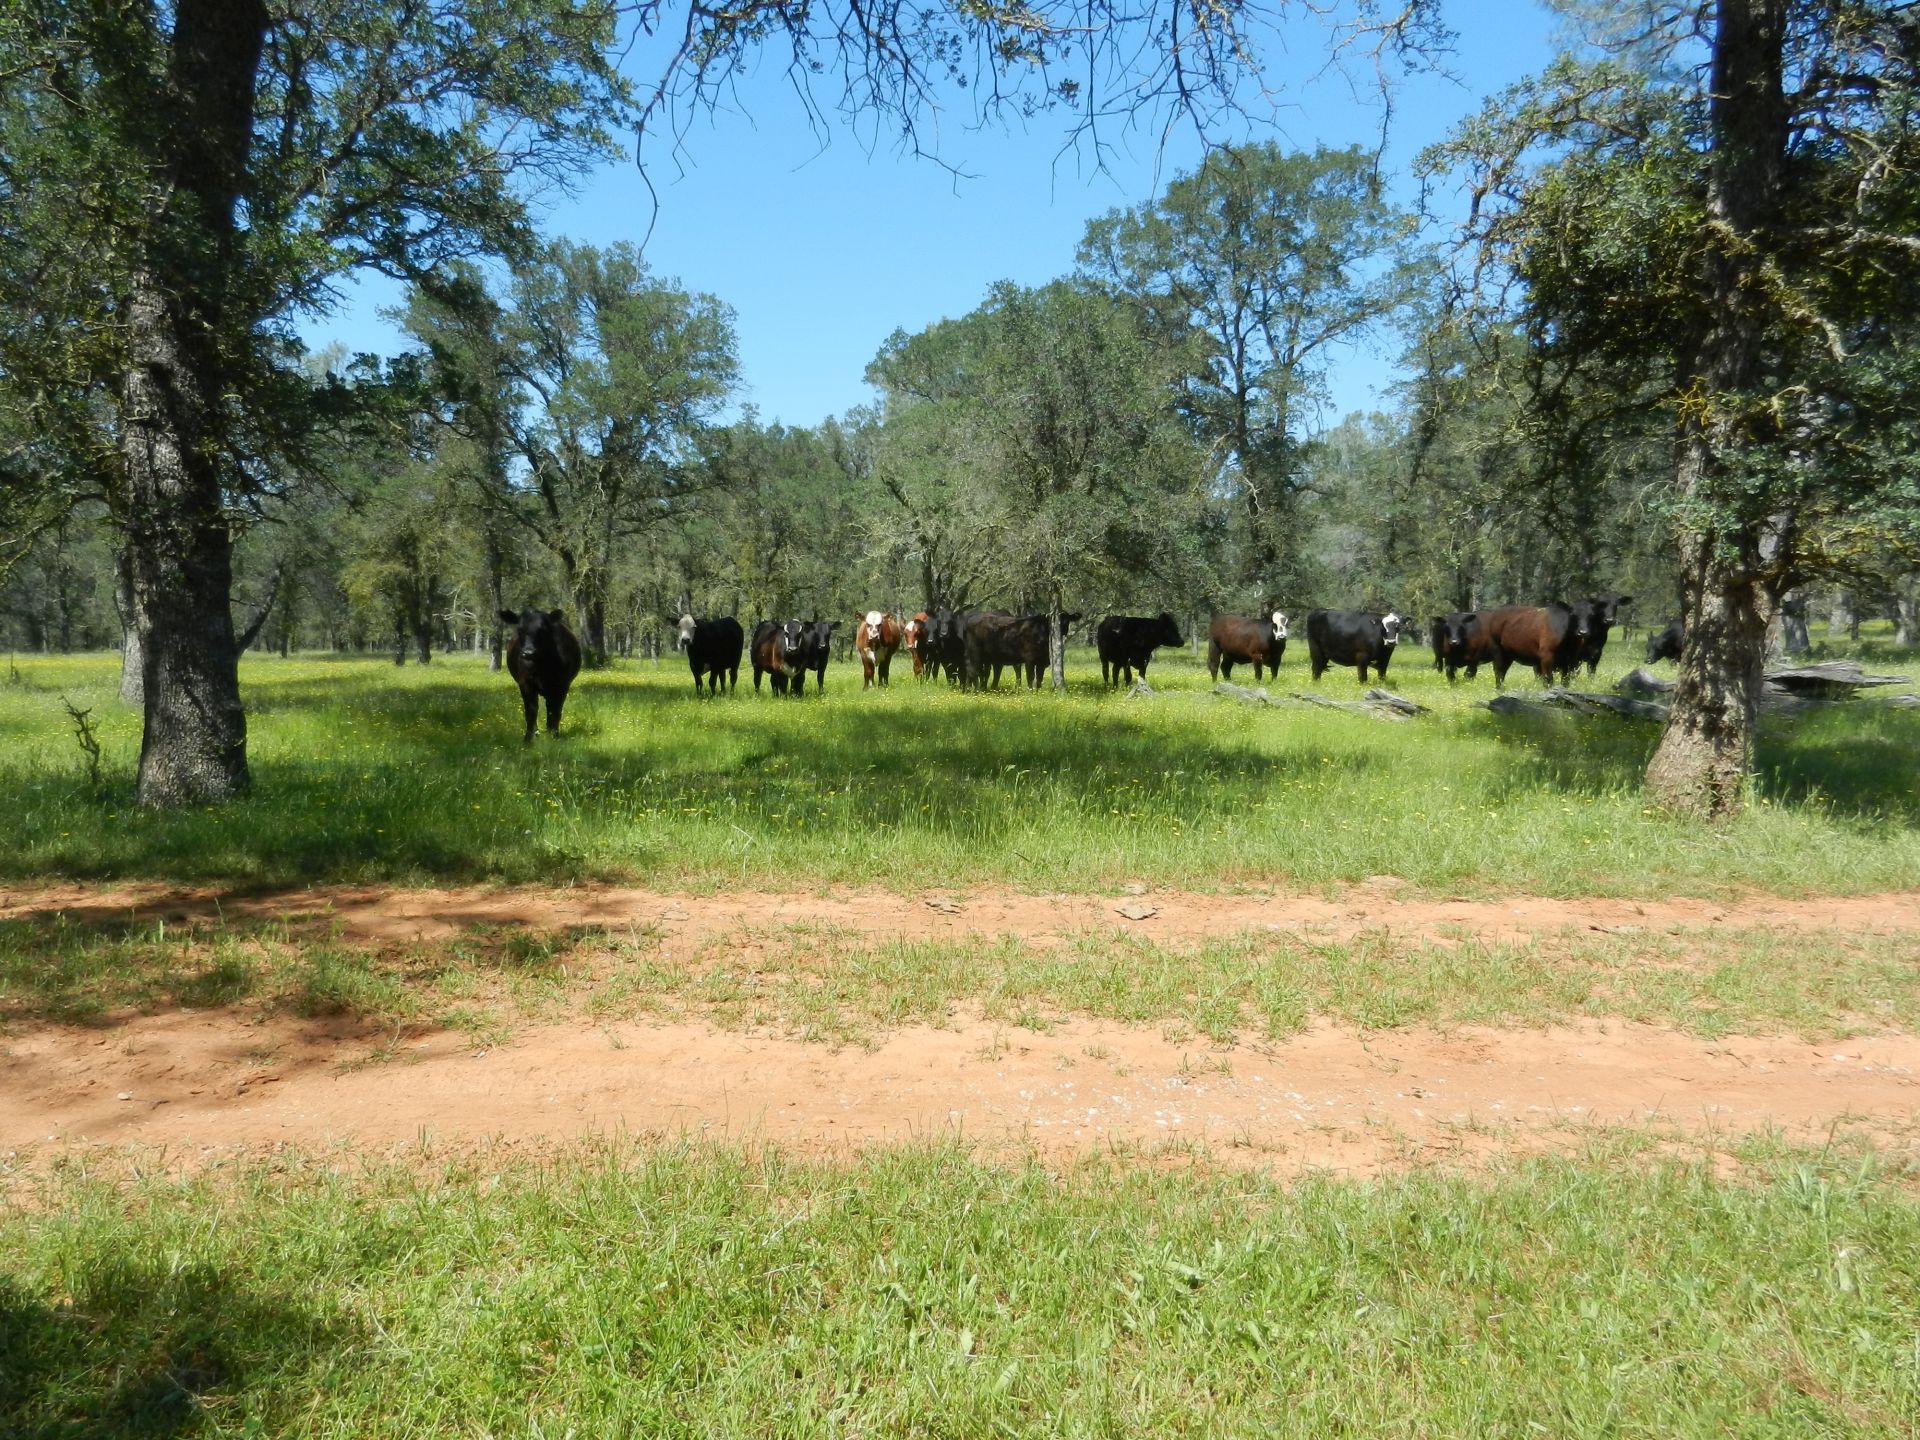
20160510TZ_Cows_tn.jpg ( 2016-05-10 15:06:08 ) Full size: 1920x1440
Cows on site
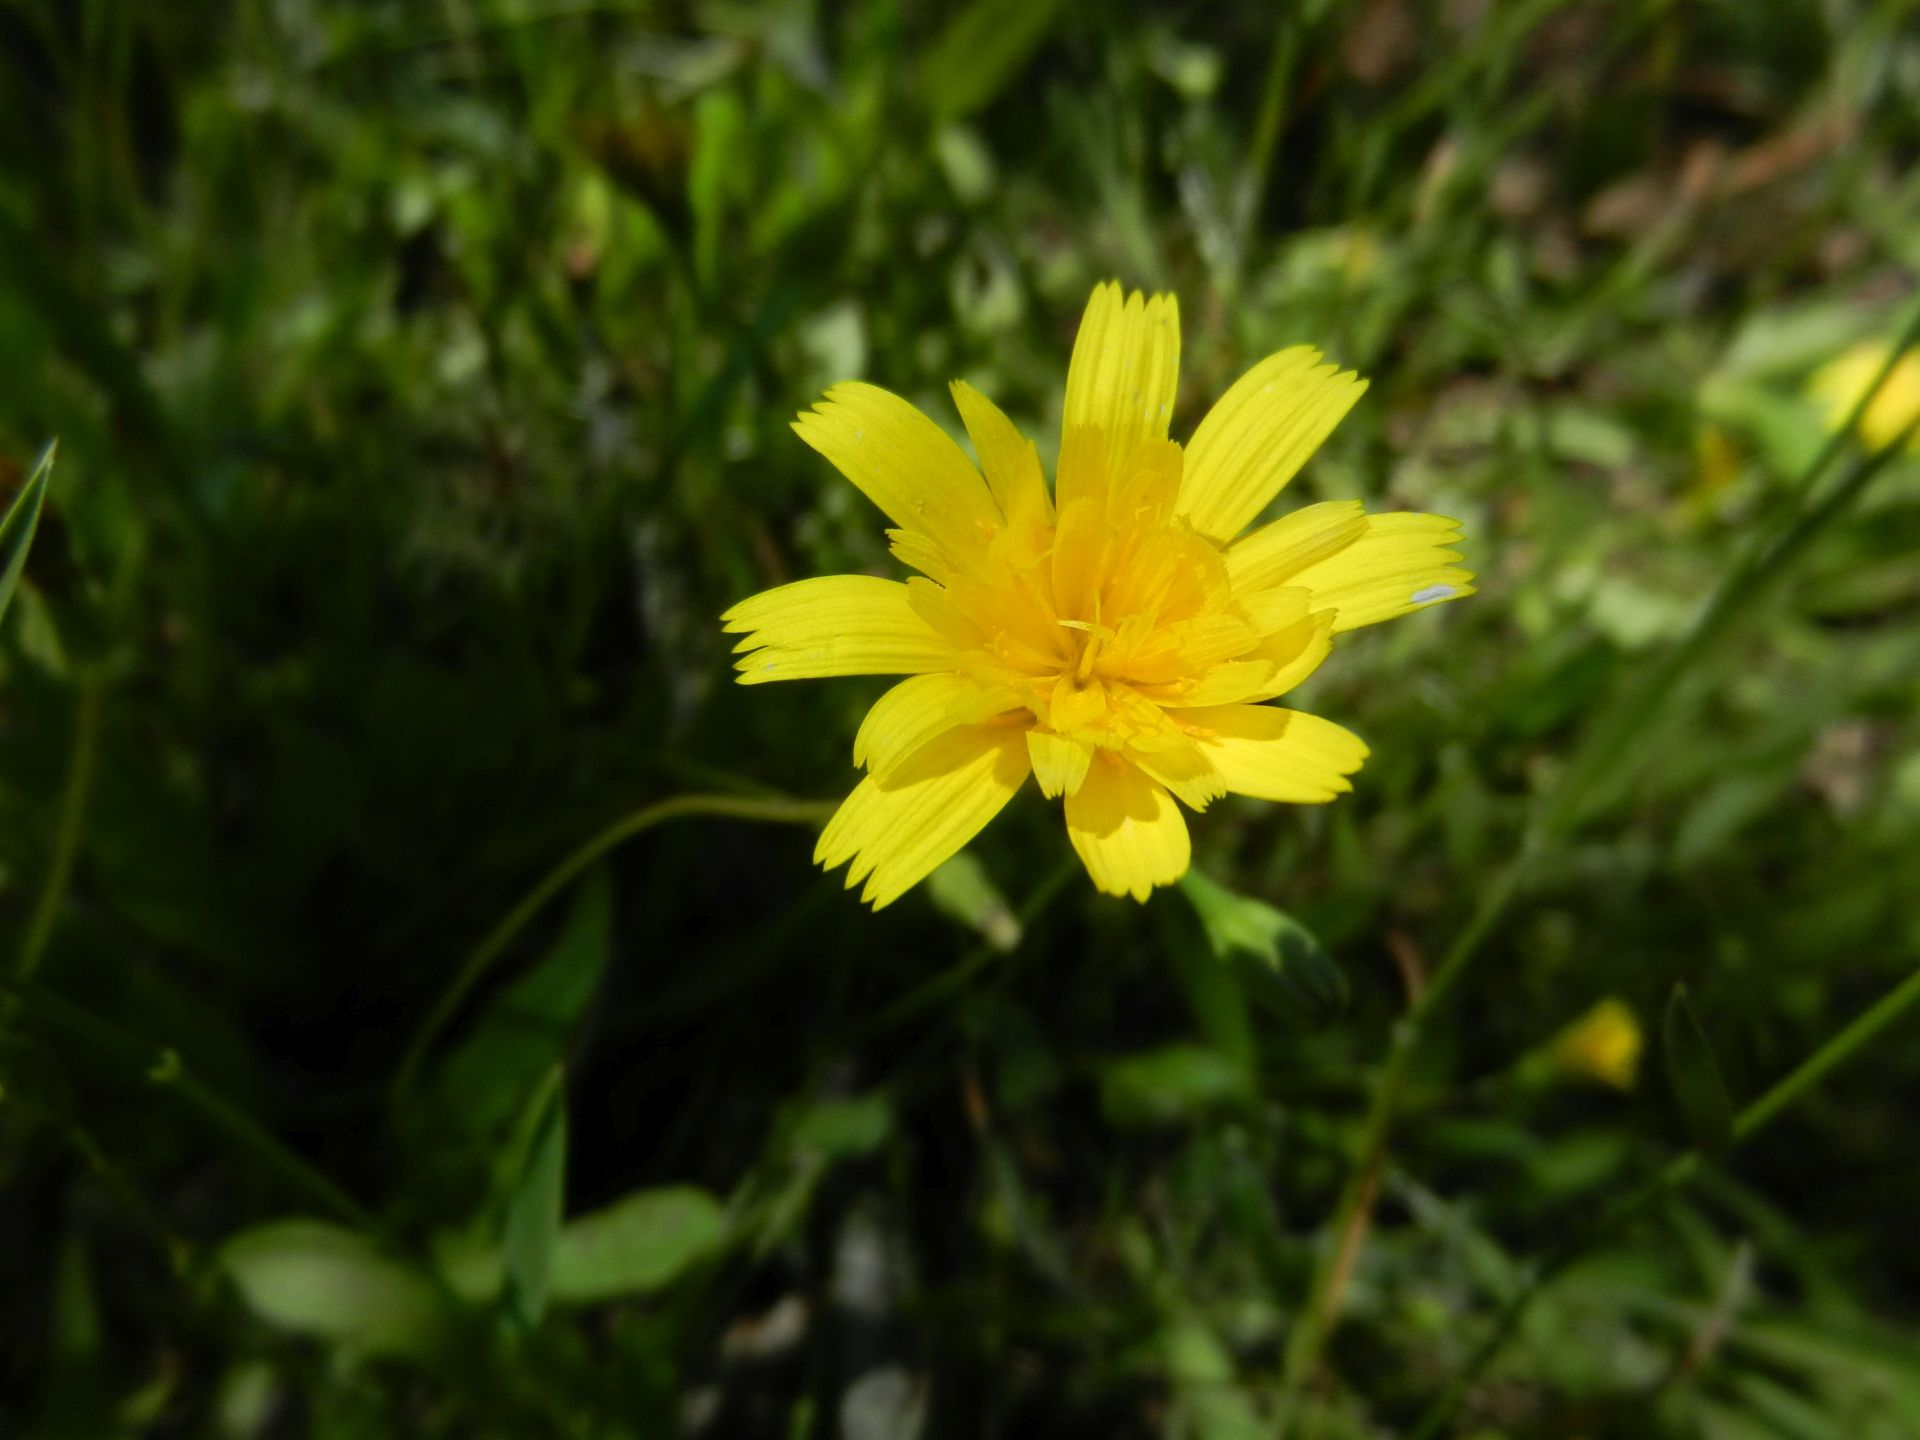
20160510TZ_Flower_tn.jpg ( 2016-05-10 15:10:08 ) Full size: 1920x1440
Yellow dandelion flower
16 sets found
No data found for TZ_Fenergy.
11 TZ_tmet graphs found
11 TZ_soilco2 graphs found
Can't check TZ_mixed
3 TZ_mixed graphs found
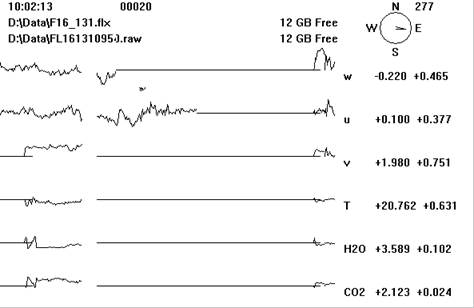
1 TZ_fflux graphs found
8 TZ_fmet graphs found
No data found for TZ_tram.
No data found for TZ_co2prof.
1 TZ_irt graphs found
No data found for TZ_windprof.
1 TZ_tflux graphs found
2 TZ_sm graphs found
Can't check TZ_met
1 TZ_met graphs found
Can't check TZVR_mixed
No data found for TZ_osu.
No data found for TZ_fd.
Tonzi Z-cam data