
Field Notes
<--2016-05-10 10:30:00 | 2016-05-26 11:00:00-->Other sites visited today: Tonzi
Phenocam link: Searching...
Tonzi: 2016-05-10 10:30:00 (DOY 131)
Author: Joe Verfaillie
Others: Siyan, Elke
Summary: Swapped 7500s, Tried to restart co2 profile, Cleaned up Tower computer box, new serial multiport, added towermet tz6 to daily data
| Tonzi 2016-05-10 I arrived about 10:30 with Siyan and Elke. It was clear, sunny and warm with a nice breeze. There were lots of flowers, but the grass has begun to turn yellow. I did not notice a change in the pond level. Cows are around. I swapped the tower 7500: sn 0418 came off and sn 0041 went on. I cleaned the radiometers. I tried to get the CO2 profile system going again. Loggernet reports control port four as stuck on, but it does not actuate the solenoid. I disconnected the port from the hardware, re-uploaded the program and even reloaded the CR10X OS. Nothing seemed to fix the problem. I think the data logger needs to be swapped out. I left the system off. I rearranged the computer box on the tower. I put in an eight port Quatec serial to USB box. This required enlarging the cable hole in the bottom of the box to move the cables to the left. And I removed the old computer lid that was glued to the bottom of the keyboard tray. The box is much neater now. I used the old Ethernet cable from the old web cam to connect the 23x at the top of the tower (tz6) to the computer. I setup up the software to send the tower met data to Berkeley daily. It all worked while I was there. The modem reported less than 1MB of its 10MB limit used. The Ethernet to the Phenocam was not working after all the box cleaning. Restarting the Phenocam seemed to fix the problem. While Siyan and Elke went to Vaira. I ran a new line of Ethernet cable to the soil moisture 23x. I put this line is plastic pipe. Eventually I want to run the power line through the pipe too and use a couple conductors of the Ethernet to control the nearby z-cam. I started running wires to connect the floor met sensors to the soil moisture 23x (tz3). I might have to extend the HMP45 wires. The barometer can be moved to the 23x box. I cleaned the z-cam windows. |
Field Data
No tank data
Well Depth
| Date | Location | Depth (feet) |
|---|---|---|
| 2016-05-10 | TZ_floor | 23.1 |
| 2016-05-10 | TZ_road | 31.5 |
| 2016-05-10 | TZ_tower | 26.7 |
mode = both
Moisture Point Probes TZ
Array
(
[0] => Tower_1
[1] => Floor_South_1
[2] => Floor_East_1
[3] => Floor_West_1
[4] => SoilCO2_1
[5] => Soil_Transect_4_1
[6] => Soil_Transect_3_1
[7] => Soil_Transect_2_1
[8] => Soil_Transect_1_1
[9] => SoilCO2_West_A_1
[10] => SoilCO2_West_B_1
[11] => SoilCO2_West_C_1
[12] => Tower_2
[13] => Floor_South_2
[14] => Floor_East_2
[15] => Floor_West_2
[16] => SoilCO2_2
[17] => Soil_Transect_4_2
[18] => Soil_Transect_3_2
[19] => Soil_Transect_2_2
[20] => Soil_Transect_1_2
[21] => SoilCO2_West_A_2
[22] => SoilCO2_West_B_2
[23] => SoilCO2_West_C_2
[24] => Tower_3
[25] => Floor_South_3
[26] => Floor_East_3
[27] => Floor_West_3
[28] => SoilCO2_3
[29] => Soil_Transect_4_3
[30] => Soil_Transect_3_3
[31] => Soil_Transect_2_3
[32] => Soil_Transect_1_3
[33] => SoilCO2_West_A_3
[34] => SoilCO2_West_B_3
[35] => SoilCO2_West_C_3
[36] => Tower_4
[37] => Floor_South_4
[38] => Floor_East_4
[39] => Floor_West_4
[40] => SoilCO2_4
[41] => Soil_Transect_4_4
[42] => Soil_Transect_3_4
[43] => Soil_Transect_2_4
[44] => Soil_Transect_1_4
[45] => SoilCO2_West_A_4
[46] => SoilCO2_West_B_4
[47] => SoilCO2_West_C_4
)
| Date | DOY | Rep | Depth | Tower_1 |
Floor_South_1 |
Floor_East_1 |
Floor_West_1 |
SoilCO2_1 |
Soil_Transect_4_1 |
Soil_Transect_3_1 |
Soil_Transect_2_1 |
Soil_Transect_1_1 |
SoilCO2_West_A_1 |
SoilCO2_West_B_1 |
SoilCO2_West_C_1 |
Tower_2 |
Floor_South_2 |
Floor_East_2 |
Floor_West_2 |
SoilCO2_2 |
Soil_Transect_4_2 |
Soil_Transect_3_2 |
Soil_Transect_2_2 |
Soil_Transect_1_2 |
SoilCO2_West_A_2 |
SoilCO2_West_B_2 |
SoilCO2_West_C_2 |
Tower_3 |
Floor_South_3 |
Floor_East_3 |
Floor_West_3 |
SoilCO2_3 |
Soil_Transect_4_3 |
Soil_Transect_3_3 |
Soil_Transect_2_3 |
Soil_Transect_1_3 |
SoilCO2_West_A_3 |
SoilCO2_West_B_3 |
SoilCO2_West_C_3 |
Tower_4 |
Floor_South_4 |
Floor_East_4 |
Floor_West_4 |
SoilCO2_4 |
Soil_Transect_4_4 |
Soil_Transect_3_4 |
Soil_Transect_2_4 |
Soil_Transect_1_4 |
SoilCO2_West_A_4 |
SoilCO2_West_B_4 |
SoilCO2_West_C_4 |
Avg | Spacial Count |
Measurement Count |
|---|---|---|---|---|---|---|---|---|---|---|---|---|---|---|---|---|---|---|---|---|---|---|---|---|---|---|---|---|---|---|---|---|---|---|---|---|---|---|---|---|---|---|---|---|---|---|---|---|---|---|---|---|---|---|
| 2016-05-10 | 131 | 0 | nan | 11.2 | 10 | 39.9 | 11.1 | 19.1 | 17.9 | 5.9 | 14.7 | 12.4 | 23.5 | 12.4 | 17.3 | 17.9 | 21.9 | 28.6 | 17 | 19.7 | 17.3 | 23.4 | 24.6 | 9.3 | 10.3 | 10.6 | 23.7 | 23.7 | 26.5 | 34.9 | 27.8 | 35.2 | 17 | 22.6 | 27.9 | 23.5 | 30.4 | 27.6 | 17.9 | 21.3 | 36.5 | 54 | 40.5 | 35.4 | 22.5 | 33.7 | 44 | 18.8 | 40.5 | 43.4 | 46.8 | |||
| 2016-05-10 | 131 | 1 | nan | 11.2 | 10.6 | 39.9 | 11.1 | 19.7 | 18.8 | 8.8 | 14.7 | 13.2 | 23.2 | 13 | 17.3 | 17.6 | 22.8 | 28.3 | 19.1 | 19.7 | 173 | 23.7 | 24.9 | 9.7 | 20.3 | 11.2 | 23.4 | 23.2 | 27.1 | 35.7 | 27.4 | 34.3 | 16.2 | 22.6 | 27.4 | 23.7 | 30.1 | 28.2 | 17 | 21.6 | 37.1 | 55.1 | 39.1 | 37.7 | 21.9 | 33.7 | 42.8 | 18.8 | 40.3 | 43.1 | 48.8 | |||
| 2016-05-10 | 131 | Avg | 0-15cm | 0 | 0 | |||||||||||||||||||||||||||||||||||||||||||||||||
| 2016-05-10 | 131 | Avg | 15-30cm | 0 | 0 | |||||||||||||||||||||||||||||||||||||||||||||||||
| 2016-05-10 | 131 | Avg | 30-45cm | 0 | 0 | |||||||||||||||||||||||||||||||||||||||||||||||||
| 2016-05-10 | 131 | Avg | 45-60cm | 0 | 0 |
mode = both
Moisture Point Probes VR
Array
(
[0] => Solar_Panels_1
[1] => Flux_Tower_1
[2] => Solar_Panels_2
[3] => Flux_Tower_2
[4] => Solar_Panels_3
[5] => Flux_Tower_3
[6] => Solar_Panels_4
[7] => Flux_Tower_4
)
| Date | DOY | Rep | Depth | Solar_Panels_1 |
Flux_Tower_1 |
Solar_Panels_2 |
Flux_Tower_2 |
Solar_Panels_3 |
Flux_Tower_3 |
Solar_Panels_4 |
Flux_Tower_4 |
Avg | Spacial Count |
Measurement Count |
|---|---|---|---|---|---|---|---|---|---|---|---|---|---|---|
| 2016-05-10 | 131 | 0 | nan | 10.3 | 8.3 | 16.7 | 13 | 19.3 | 8.1 | 31.4 | 18.5 | |||
| 2016-05-10 | 131 | 1 | nan | 8.6 | 8.6 | 16.7 | 12.7 | 19.5 | 8.1 | 31.1 | 18.2 | |||
| 2016-05-10 | 131 | Avg | 0-15cm | 0 | 0 | |||||||||
| 2016-05-10 | 131 | Avg | 15-30cm | 0 | 0 | |||||||||
| 2016-05-10 | 131 | Avg | 30-45cm | 0 | 0 | |||||||||
| 2016-05-10 | 131 | Avg | 45-60cm | 0 | 0 |
No TZ grass heigth found
Grass Height VR 16
| Date | Height reps (cm) | Location | Average | Samp | STDEV | |||||||||||||||
|---|---|---|---|---|---|---|---|---|---|---|---|---|---|---|---|---|---|---|---|---|
| 2016-05-10 | 82 | 65 | 96 | 66 | 62 | 71 | 88 | 54 | 58 | 67 | 24 | 56 | 99 | 92 | 41 | GH_ALL | 68.07 | 15 | 20.13 | |
Tree DBH
| Date | Tag# | Reading (mm) |
|---|---|---|
| 2016-05-10 | 1 | 22.7 |
| 2016-05-10 | 102 | 18.7 |
| 2016-05-10 | 2 | 18.3 |
| 2016-05-10 | 245 | 22.9 |
| 2016-05-10 | 3 | 21.5 |
| 2016-05-10 | 4 | 16.2 |
| 2016-05-10 | 5 | 17.3 |
| 2016-05-10 | 7 | 15.5 |
| 2016-05-10 | 72 | 23.2 |
| 2016-05-10 | 79 | 23.4 |
| 2016-05-10 | 8 | 18.6 |
Water Potential - mode: raw
| Time | Species | Tree | readings (bar) | ||
|---|---|---|---|---|---|
| 2016-05-10 00:00:00 | OAK | 102 | -11 | -7 | -8 |
| 2016-05-10 00:00:00 | OAK | 35 | -10 | -13 | -20 |
| 2016-05-10 00:00:00 | OAK | 92 | -22 | -25 | -26 |
| 2016-05-10 00:00:00 | PINE | OLD | -4 | -21 | -21 |
| 2016-05-10 00:00:00 | PINE | YNG | -2 | -5 | -7 |
No TZ Grass Biomass data found
No TZ OakLeaves Biomass data found
No TZ PineNeedles Biomass data found
2 photos found
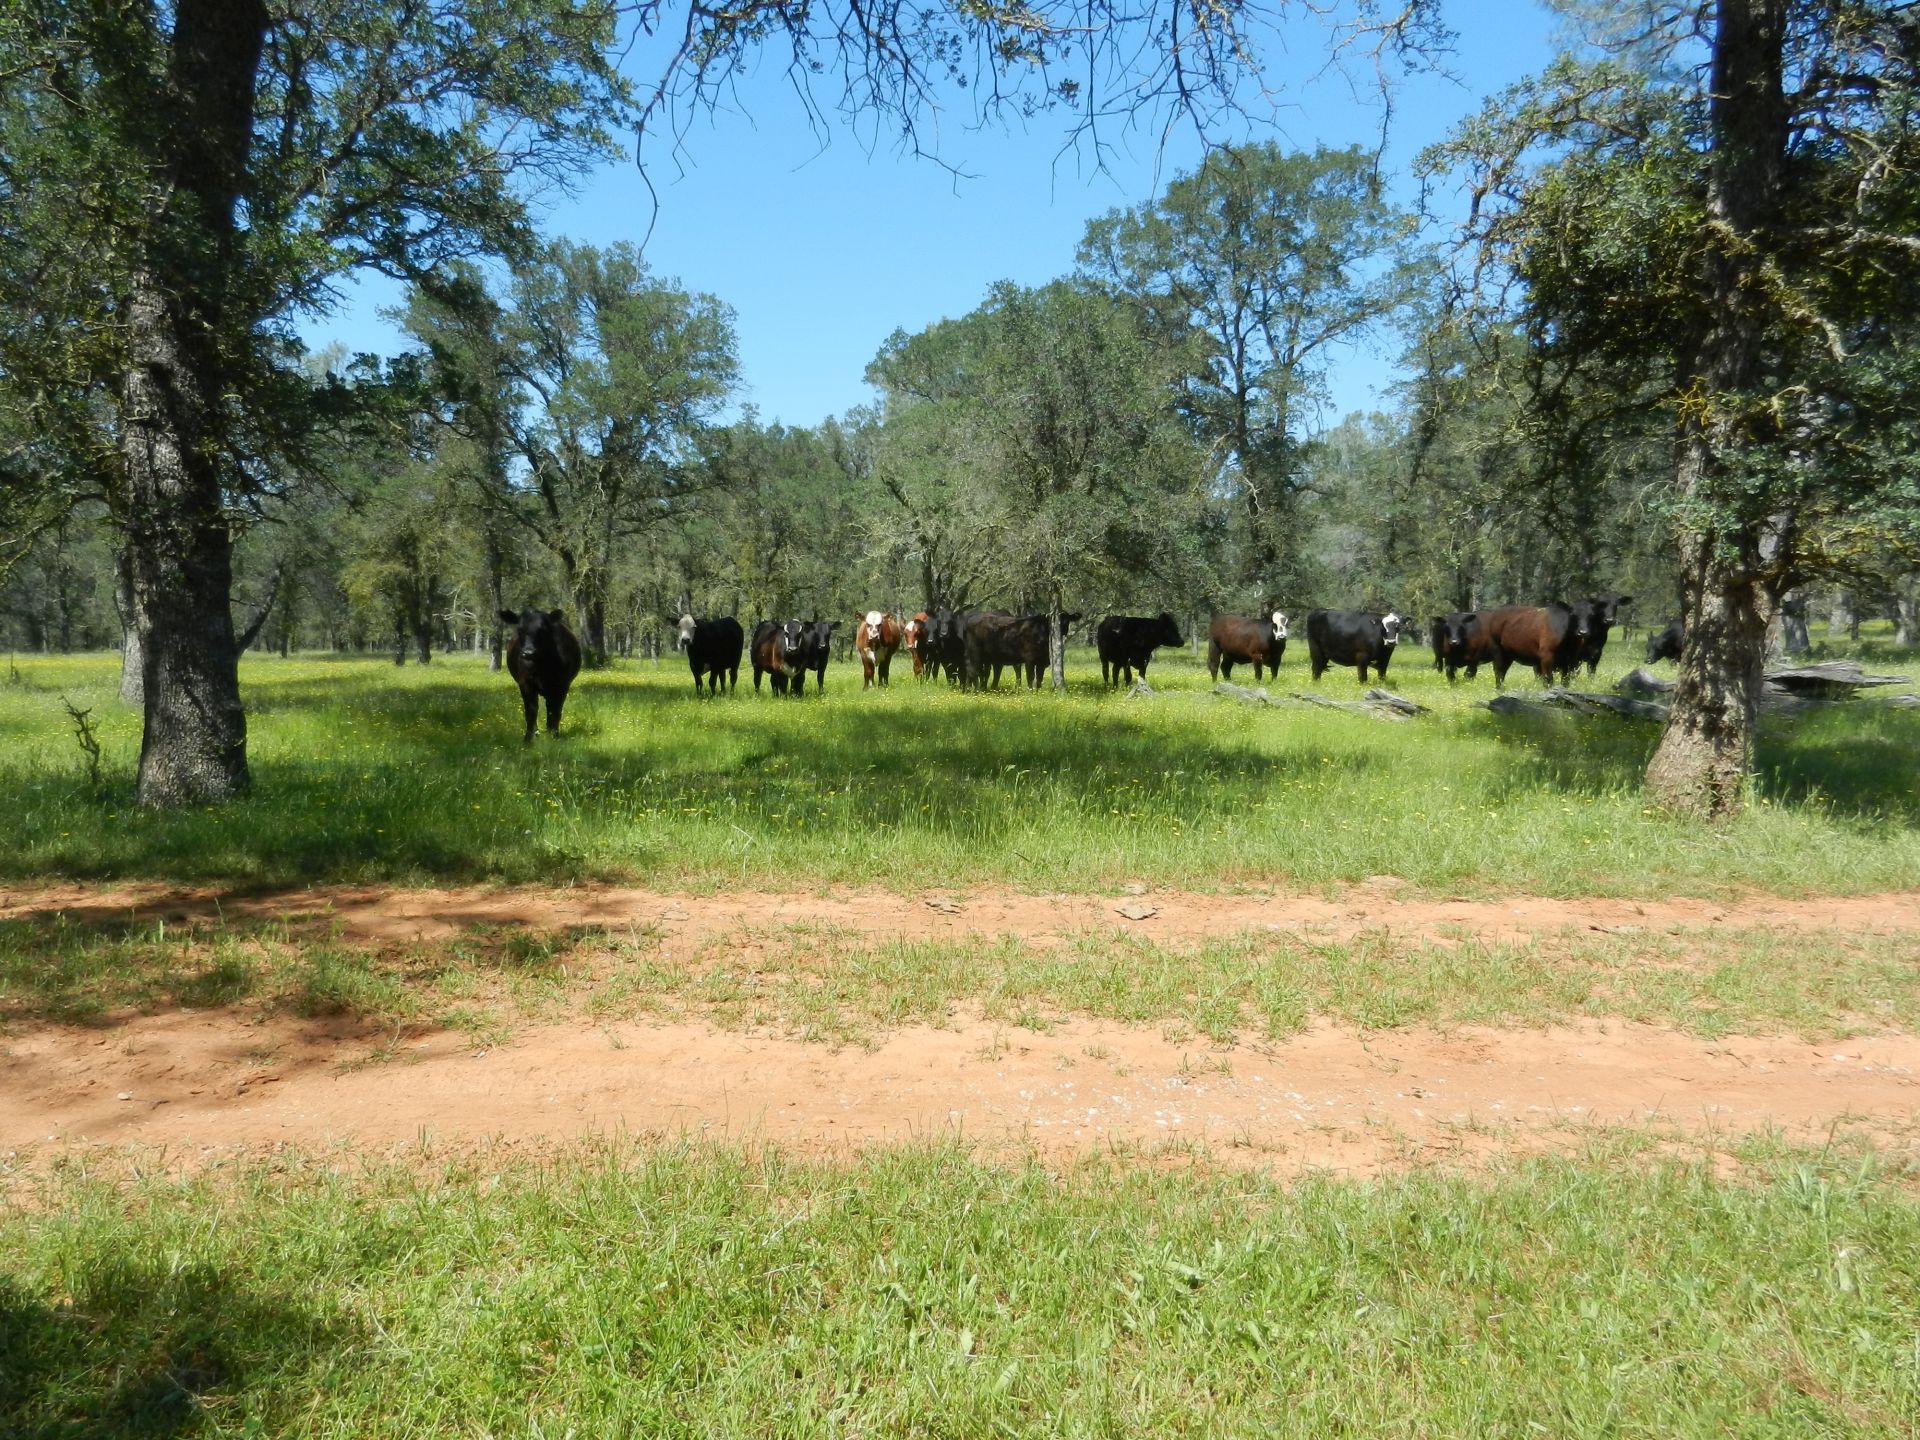
20160510TZ_Cows_tn.jpg ( 2016-05-10 15:06:08 ) Full size: 1920x1440
Cows on site
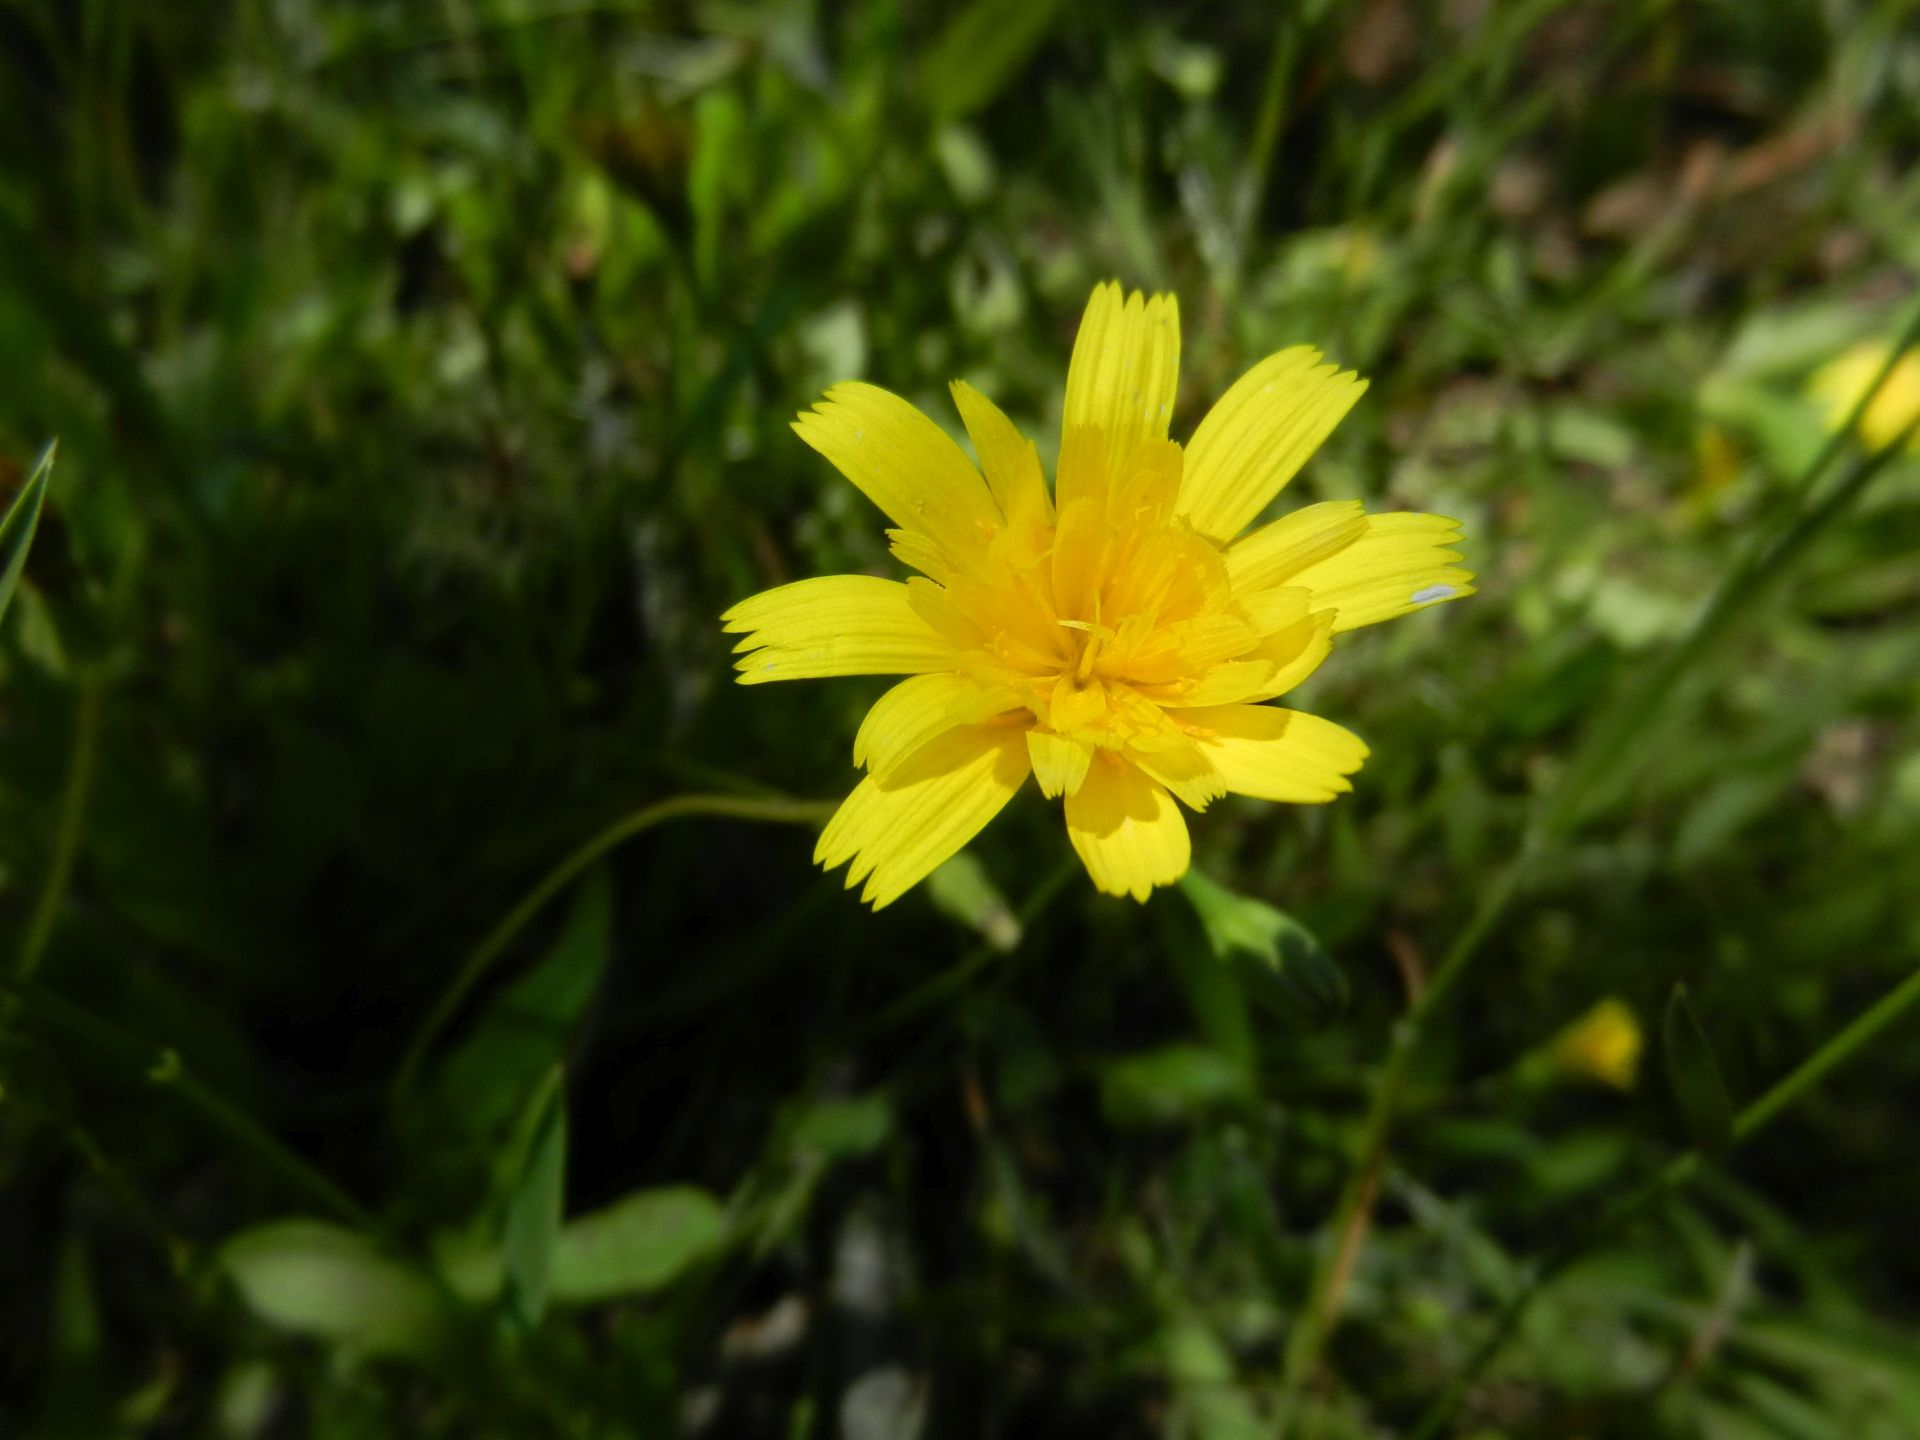
20160510TZ_Flower_tn.jpg ( 2016-05-10 15:10:08 ) Full size: 1920x1440
Yellow dandelion flower
16 sets found
No data found for TZ_Fenergy.
11 TZ_tmet graphs found
11 TZ_soilco2 graphs found
Can't check TZ_mixed
3 TZ_mixed graphs found
1 TZ_fflux graphs found
8 TZ_fmet graphs found
No data found for TZ_tram.
No data found for TZ_co2prof.
1 TZ_irt graphs found
No data found for TZ_windprof.
1 TZ_tflux graphs found
2 TZ_sm graphs found
Can't check TZ_met
1 TZ_met graphs found
Can't check TZVR_mixed
No data found for TZ_osu.
No data found for TZ_fd.
Tonzi Z-cam data