
Field Notes
<--2016-04-12 09:00:00 | 2016-04-25 10:30:00-->Phenocam link: Searching...
Tonzi: 2016-04-20 10:30:00 (DOY 111)
Author: Siyan Ma
Others:
Summary: Standard fieldwork and data collection, Ameriflux inter-comparison running, midday water potential
|
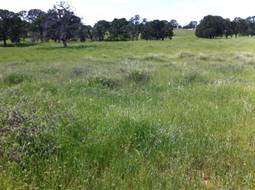
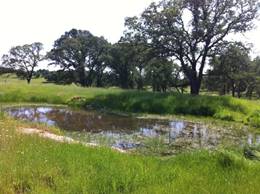
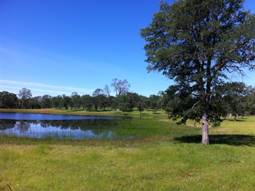
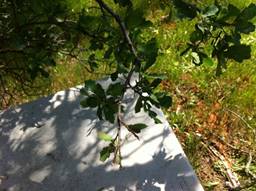
When: Date: 4/20/2016 , Day: 111 , Watch Time: 10:30 am . Where: Tonzi/Vaira Ranch Who: Siyan Weather: clear, sunny Phenology: AmeriFlux comparison was running on site; a beautiful spring day; soil moisture still good; grassland looked patchy at Vaira; the density of oak leaves looked lower this year probably because severe previous droughts reduced establishment of leaf buds (see the picture below: no leaves on some twigs where leaves should grow supposedly)
Summary
Vaira_Grass Site
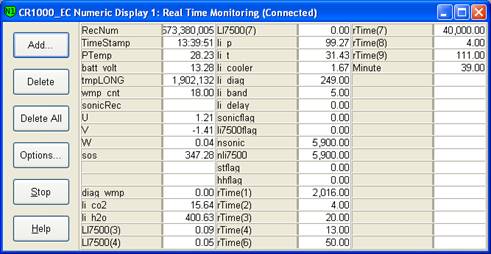
Tonzi_Tower Site
6. closed gate and set up fence. YES! Toniz_Floor Site
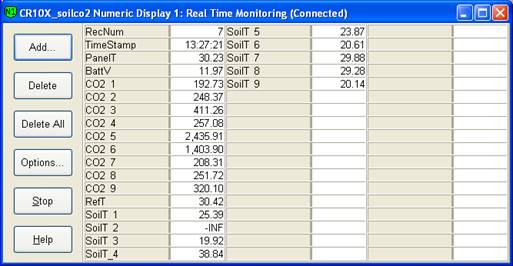
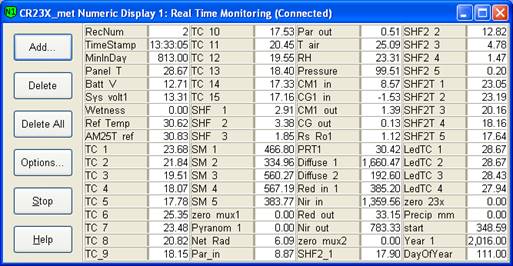
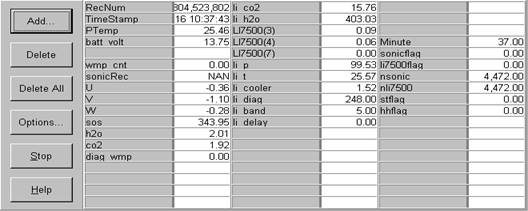
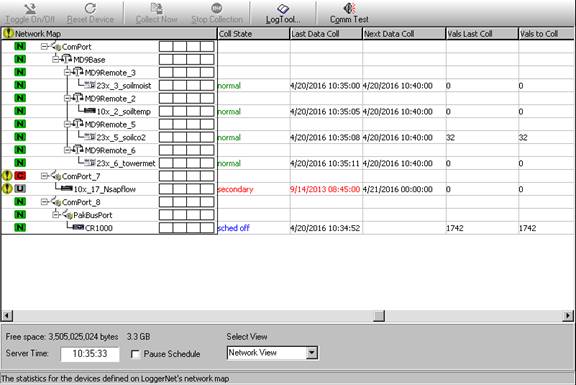
CR23X3 – floor-Met CR23X6 – tower-Met CR10X2 – floor-Met Soil CO2 profile: CR23X5 – soil CO2 profile
|

Veg Height (cm): Tape measure from ground to top of plant
17, 32, 20, 22, 21, 20, 20, 26, 19, 24, 45, 30, 32, 15, 25, 17, 20, 21, 20, 19, avg = 23.3, stdev = 7
Field Data
No tank data
Well Depth
| Date | Location | Depth (feet) |
|---|---|---|
| 2016-04-20 | TZ_floor | 23.5 |
| 2016-04-20 | TZ_road | 31.9 |
| 2016-04-20 | TZ_tower | 26.7 |
mode = both
Moisture Point Probes TZ
Array
(
[0] => Tower_1
[1] => Floor_South_1
[2] => Floor_East_1
[3] => Floor_West_1
[4] => SoilCO2_1
[5] => Soil_Transect_4_1
[6] => Soil_Transect_3_1
[7] => Soil_Transect_2_1
[8] => Soil_Transect_1_1
[9] => SoilCO2_West_A_1
[10] => SoilCO2_West_B_1
[11] => SoilCO2_West_C_1
[12] => Tower_2
[13] => Floor_South_2
[14] => Floor_East_2
[15] => Floor_West_2
[16] => SoilCO2_2
[17] => Soil_Transect_4_2
[18] => Soil_Transect_3_2
[19] => Soil_Transect_2_2
[20] => Soil_Transect_1_2
[21] => SoilCO2_West_A_2
[22] => SoilCO2_West_B_2
[23] => SoilCO2_West_C_2
[24] => Tower_3
[25] => Floor_South_3
[26] => Floor_East_3
[27] => Floor_West_3
[28] => SoilCO2_3
[29] => Soil_Transect_4_3
[30] => Soil_Transect_3_3
[31] => Soil_Transect_2_3
[32] => Soil_Transect_1_3
[33] => SoilCO2_West_A_3
[34] => SoilCO2_West_B_3
[35] => SoilCO2_West_C_3
[36] => Tower_4
[37] => Floor_South_4
[38] => Floor_East_4
[39] => Floor_West_4
[40] => SoilCO2_4
[41] => Soil_Transect_4_4
[42] => Soil_Transect_3_4
[43] => Soil_Transect_2_4
[44] => Soil_Transect_1_4
[45] => SoilCO2_West_A_4
[46] => SoilCO2_West_B_4
[47] => SoilCO2_West_C_4
)
| Date | DOY | Rep | Depth | Tower_1 |
Floor_South_1 |
Floor_East_1 |
Floor_West_1 |
SoilCO2_1 |
Soil_Transect_4_1 |
Soil_Transect_3_1 |
Soil_Transect_2_1 |
Soil_Transect_1_1 |
SoilCO2_West_A_1 |
SoilCO2_West_B_1 |
SoilCO2_West_C_1 |
Tower_2 |
Floor_South_2 |
Floor_East_2 |
Floor_West_2 |
SoilCO2_2 |
Soil_Transect_4_2 |
Soil_Transect_3_2 |
Soil_Transect_2_2 |
Soil_Transect_1_2 |
SoilCO2_West_A_2 |
SoilCO2_West_B_2 |
SoilCO2_West_C_2 |
Tower_3 |
Floor_South_3 |
Floor_East_3 |
Floor_West_3 |
SoilCO2_3 |
Soil_Transect_4_3 |
Soil_Transect_3_3 |
Soil_Transect_2_3 |
Soil_Transect_1_3 |
SoilCO2_West_A_3 |
SoilCO2_West_B_3 |
SoilCO2_West_C_3 |
Tower_4 |
Floor_South_4 |
Floor_East_4 |
Floor_West_4 |
SoilCO2_4 |
Soil_Transect_4_4 |
Soil_Transect_3_4 |
Soil_Transect_2_4 |
Soil_Transect_1_4 |
SoilCO2_West_A_4 |
SoilCO2_West_B_4 |
SoilCO2_West_C_4 |
Avg | Spacial Count |
Measurement Count |
|---|---|---|---|---|---|---|---|---|---|---|---|---|---|---|---|---|---|---|---|---|---|---|---|---|---|---|---|---|---|---|---|---|---|---|---|---|---|---|---|---|---|---|---|---|---|---|---|---|---|---|---|---|---|---|
| 2016-04-20 | 111 | 0 | nan | 14.4 | 9.7 | 39.9 | 18.1 | 19.9 | 19.1 | 10.3 | 15 | 14.1 | 20.6 | 10.6 | 14.7 | 22.2 | 23.1 | 24 | 19.7 | 20.3 | 17.3 | 23.7 | 25.8 | 10.6 | 21.9 | 10.6 | 22.2 | 30.1 | 29 | 32.1 | 31 | 40.5 | 20.1 | 24.6 | 29 | 26 | 30.7 | 28.8 | 20.4 | 32.8 | 57.4 | 57.7 | 53.1 | 41.1 | 24.5 | 37.4 | 45.1 | 21.1 | 41.4 | 45.7 | 41.4 | |||
| 2016-04-20 | 111 | 1 | nan | 13.5 | 9.4 | 39.9 | 18.8 | 19.8 | 20.3 | 10 | 14.4 | 14.4 | 21.2 | 10.3 | 13.5 | 22.5 | 22.5 | 24.3 | 17.6 | 21 | 18.2 | 23.4 | 25.5 | 10.9 | 21.8 | 10.3 | 22.2 | 29.9 | 27.9 | 32.7 | 31 | 39.9 | 19.8 | 25.1 | 28.5 | 25.7 | 30.1 | 28.5 | 21.2 | 33.1 | 70 | 60.3 | 42.8 | 41.4 | 24.5 | 37.1 | 44.8 | 20.2 | 40.8 | 46.6 | 41.4 | |||
| 2016-04-20 | 111 | Avg | 0-15cm | 0 | 0 | |||||||||||||||||||||||||||||||||||||||||||||||||
| 2016-04-20 | 111 | Avg | 15-30cm | 0 | 0 | |||||||||||||||||||||||||||||||||||||||||||||||||
| 2016-04-20 | 111 | Avg | 30-45cm | 0 | 0 | |||||||||||||||||||||||||||||||||||||||||||||||||
| 2016-04-20 | 111 | Avg | 45-60cm | 0 | 0 |
mode = both
Moisture Point Probes VR
Array
(
[0] => Solar_Panels_1
[1] => Flux_Tower_1
[2] => Gate_1
[3] => Biomass_Cage_1
[4] => Solar_Panels_2
[5] => Flux_Tower_2
[6] => Gate_2
[7] => Biomass_Cage_2
[8] => Solar_Panels_3
[9] => Flux_Tower_3
[10] => Gate_3
[11] => Biomass_Cage_3
[12] => Solar_Panels_4
[13] => Flux_Tower_4
[14] => Gate_4
[15] => Biomass_Cage_4
)
| Date | DOY | Rep | Depth | Solar_Panels_1 |
Flux_Tower_1 |
Gate_1 |
Biomass_Cage_1 |
Solar_Panels_2 |
Flux_Tower_2 |
Gate_2 |
Biomass_Cage_2 |
Solar_Panels_3 |
Flux_Tower_3 |
Gate_3 |
Biomass_Cage_3 |
Solar_Panels_4 |
Flux_Tower_4 |
Gate_4 |
Biomass_Cage_4 |
Avg | Spacial Count |
Measurement Count |
|---|---|---|---|---|---|---|---|---|---|---|---|---|---|---|---|---|---|---|---|---|---|---|
| 2016-04-20 | 111 | 0 | nan | 9.1 | 10.9 | 8.3 | 2.1 | 19.4 | 17.3 | 11.5 | 10.6 | 23.5 | 9.8 | 15.1 | 19.5 | 35.1 | 21.1 | 13.9 | 20.5 | |||
| 2016-04-20 | 111 | 1 | nan | 9.9 | 11.2 | 8.3 | 2.7 | 19.1 | 17 | 11.2 | 10.6 | 22.6 | 10.9 | 15.6 | 19.3 | 34.8 | 21.1 | 13.3 | 18.2 | |||
| 2016-04-20 | 111 | Avg | 0-15cm | 0 | 0 | |||||||||||||||||
| 2016-04-20 | 111 | Avg | 15-30cm | 0 | 0 | |||||||||||||||||
| 2016-04-20 | 111 | Avg | 30-45cm | 0 | 0 | |||||||||||||||||
| 2016-04-20 | 111 | Avg | 45-60cm | 0 | 0 |
Grass Height TZ 15
| Date | Height reps (cm) | Location | Average | Samp | STDEV | ||||||||||||||
|---|---|---|---|---|---|---|---|---|---|---|---|---|---|---|---|---|---|---|---|
| 2016-04-20 | 32 | 22 | 20 | 26 | 24 | 45 | 30 | 32 | 15 | 25 | 17 | 20 | 21 | 20 | 19 | GH_ALL | 23.25 | 20 | 6.82 |
Grass Height VR 5
| Date | Height reps (cm) | Location | Average | Samp | STDEV | ||||
|---|---|---|---|---|---|---|---|---|---|
| 2016-04-20 | 70 | 67 | 60 | 65 | 63 | GH_ALL | 65 | 5 | 3.41 |
Tree DBH
| Date | Tag# | Reading (mm) |
|---|---|---|
| 2016-04-20 | 1 | 21.3 |
| 2016-04-20 | 102 | 17.4 |
| 2016-04-20 | 245 | 22.9 |
| 2016-04-20 | 4 | 15.5 |
| 2016-04-20 | 5 | 17.6 |
| 2016-04-20 | 7 | 14.9 |
| 2016-04-20 | 72 | 22.8 |
| 2016-04-20 | 79 | 22.5 |
| 2016-04-20 | 8 | 18.1 |
Water Potential - mode: raw
| Time | Species | Tree | readings (bar) | ||
|---|---|---|---|---|---|
| 2016-04-20 13:08:00 | OAK | 102 | -10 | -10 | -9.5 |
| 2016-04-20 13:08:00 | OAK | 35 | -15 | -16 | -18 |
| 2016-04-20 13:08:00 | OAK | 92 | -3 | -22 | -5 |
| 2016-04-20 13:15:00 | PINE | OLD | -2 | -4 | -22 |
| 2016-04-20 13:15:00 | PINE | YNG | -1 | -8 | -6 |
No TZ Grass Biomass data found
No TZ OakLeaves Biomass data found
No TZ PineNeedles Biomass data found
0 photos found
16 sets found
No data found for TZ_Fenergy.
11 TZ_tmet graphs found
11 TZ_soilco2 graphs found
Can't check TZ_mixed
3 TZ_mixed graphs found
1 TZ_fflux graphs found
8 TZ_fmet graphs found
No data found for TZ_tram.
No data found for TZ_co2prof.
1 TZ_irt graphs found
No data found for TZ_windprof.
1 TZ_tflux graphs found
2 TZ_sm graphs found
Can't check TZ_met
1 TZ_met graphs found
Can't check TZVR_mixed
No data found for TZ_osu.
No data found for TZ_fd.
Tonzi Z-cam data