Field Notes
<--2006-12-26 11:30:00 |
2007-01-19 09:30:00-->
Other sites visited today:
Vaira
Phenocam link:
Searching...Tonzi: 2007-01-10 00:00:00 (DOY 10)
Author: Siyan Ma
Others: Dennis, Youngryrel, Becca
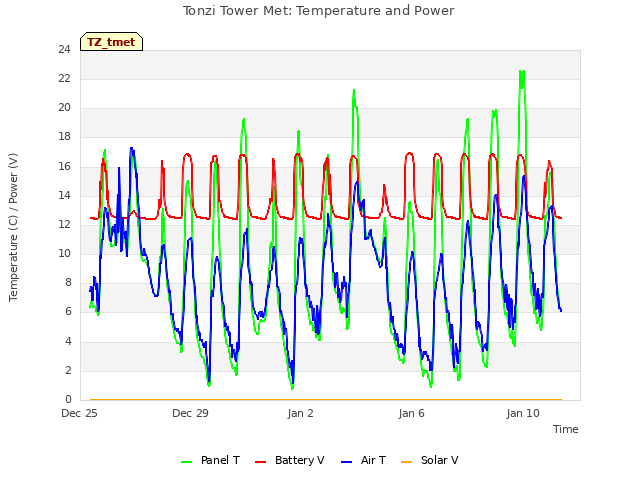
Tonzi_Tower Site
- Fence and gate power: >12 v.
- Panel and Batteries: 12.9
v; 0.0 amps; 4.4
amps.
- Reading from Gillsonic screen
before downloading data. (The value
of H2O and CO2 should be in the range of 0 – 5 v.)
13:06:18
|
|
Path/File name
|
D:\Data\T07_010 .flx
D:\Data\TW0701010300.raw
|
|
mean
|
std
|
|
mean
|
std
|
w
|
0.55
|
0.502
|
Ts
|
15.777
|
0.577
|
u
|
-0.07
|
0.520
|
H2O
|
1.967
|
0.043
|
v
|
2.60
|
1.370
|
CO2
|
2.046
|
0.033
|
- downloading data OK
- PC time was about one second difference from GPS. No correction was taken.
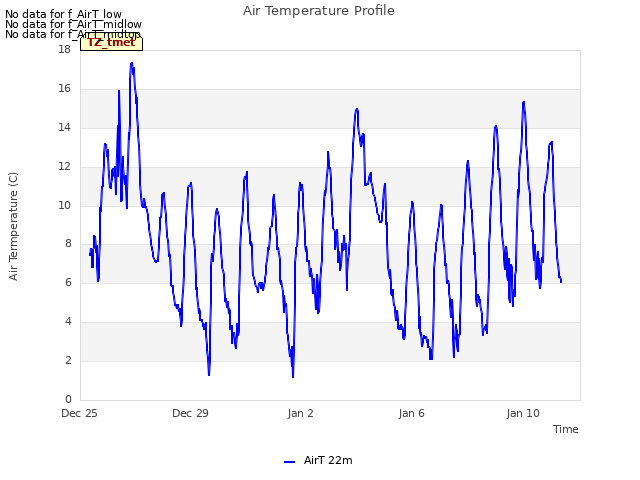
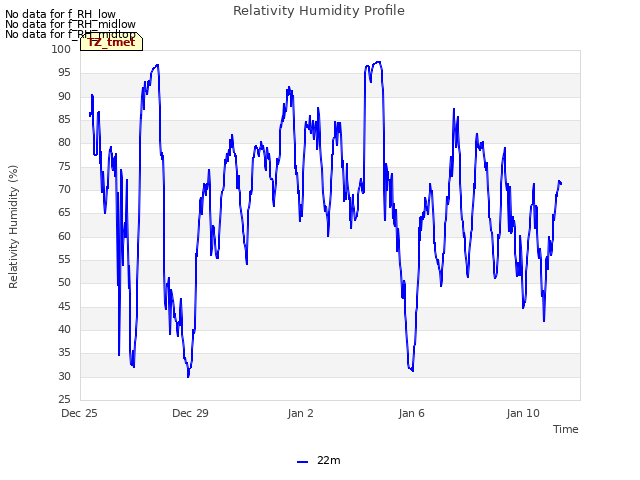
- check the fans of air temp.
and relative humidity sensors on the tower and the floor.
- Check calibration cylinders;
CO 2 1000 psig; flow 18
psi.
N 2 1300
psig; flow 20 psi.
Manually calibrate Li-800. Following Ted’s instruction: H:\IoneSavanna_2004\Tower_2004\CO2Profile\LI800_Calibration_Procedure_2Nov04.txt
Is the pump running OK
- close gate and set up fence. OK
Toniz_Floor
Site
- Fence and gate power: 12
v.
- Panel and Batteries: (OK) v; (OK) amps; (OK) amps.
- Reading from Gillsonic screen
before downloading data. (The value
of H2O and CO2 should be in the range of 0 – 5 v.)
Time
|
|
Path/File name
|
D:\Data\F06_
.flx
D:\Data\FL06 .raw
|
|
mean
|
std
|
|
mean
|
std
|
w
|
-0.07
|
|
Ts
|
16.625
|
|
u
|
-0.48
|
|
H2O
|
2.30
|
|
v
|
0.23
|
|
CO2
|
1.95
|
|
- downloading data: OK
- Check MD-9 system
connections: OK
CR23X3 – floor-Met
CR23X5 – soil CO 2
profile
CR23X6 – tower-Met
CR10X2 – floor-Met
CR10X4 – sap-flow
CR10X7 – CO 2 profile
CR10X8 – wind profile
CR1021 – Xingyuan’s sap flow
=>didn’t download any data since D334, 2006.
- Soil CO2 profile
Reading
from datalogger
Panel
temp
|
14.2
|
|
|
Battery
voltage
|
13.19
|
|
|
CO2E_1
|
514
|
TCE_1
|
10.6
|
CO2W_1
|
487
|
TCW_1
|
11.9
|
CO2E_2
|
723
|
TCE_2
|
11.6
|
CO2W_2
|
834
|
TCW_2
|
12.610.6
|
CO2E_3
|
935
|
TCE_3
|
8.3
|
CO2W_3
|
1495
|
TCW_3
|
12.210.2
|
CO2E_4
|
1221
|
TCE_4
|
6.9
|
CO2W_4
|
2419
|
TCW_4
|
12.310.2
|
- soil moisture (TDR)
tonzi
|
7931AFE
|
402165
|
574B4B
|
402FF3
|
574632
|
7A432E
|
7A3C6E
|
7A3B40
|
7A4AAA
|
10-Jan-07
|
10
|
|
|
|
|
|
|
|
|
|
SM
|
|
|
|
|
|
|
|
|
0-15
|
22.3
|
23.0
|
36.2
|
29.8
|
24.6
|
24.7
|
23.0
|
21.1
|
15.4
|
15-30
|
27.6
|
34.1
|
32.4
|
36.9
|
32.2
|
20.1
|
34.4
|
30.9
|
11.4
|
30-45
|
21.2
|
18.7
|
43.3
|
43.4
|
28.4
|
21.8
|
38.1
|
31.6
|
21.5
|
45-60
|
16.6
|
7.1
|
47.3
|
35.5
|
40.2
|
21.3
|
40.2
|
37.3
|
10.5
|
|
|
|
|
|
|
|
|
|
|
|
A6D882B
|
A3D04E8
|
A6D72F5
|
|
|
|
|
|
|
|
|
|
|
|
|
|
|
|
|
0-15
|
33.0
|
28.8
|
16.1
|
|
|
|
|
|
|
15-30
|
22.1
|
27.0
|
29.8
|
|
|
|
|
|
|
30-45
|
31.7
|
33.5
|
32.4
|
|
|
|
|
|
|
45-60
|
37.6
|
46.1
|
42.7
|
|
|
|
|
|
|
|
|
|
|
|
|
|
|
|
|
vaira
|
57318a
|
7933dee
|
|
|
|
|
|
|
|
0-15
|
19.7
|
23.5
|
|
|
|
|
|
|
|
15-30
|
28.4
|
31.8
|
|
|
|
|
|
|
|
30-45
|
30.7
|
31.1
|
|
|
|
|
|
|
|
45-60
|
32.1
|
37.3
|
|
|
|
|
|
|
|
- Close gate and set up fence.
Tonzi
|
|
|
|
Dendrometer
|
|
|
|
|
|
|
Date
|
Day
|
Tag #
|
Reading (cm)
|
1/10/2006
|
10
|
71
|
22.9
|
|
|
72
|
23.5
|
|
|
77
|
Broken
|
|
|
78
|
Broken
|
|
|
79
|
23.4
|
|
|
245
|
22.7
|
|
|
248
|
Out of range
|
|
|
250
|
21.6
|
|
|
255
|
22.1
|
|
|
252
|
missing
|
|
|
102
|
Broken
|
Sample sheet for MIBA
Sample vial
|
What
|
MIBA-US-01.-
|
Leave 1
|
MIBA-US-01. -
|
Leave 2
|
MIBA-US-01. 203
|
Grass 1
|
MIBA-US-01. 204
|
Grass 2
|
MIBA-US-01. 205
|
Soil in 10 cm
|
MIBA-US-01. 206
|
Stem 1
|
MIBA-US-01. 207
|
Stem 2
|
|
Field Data
No tank data
No TZ Well data found
No TZ Moisture Point data found
No VR Moisture Point data found
No TZ grass heigth found
No VR grass heigth found
No TZ Tree DBH found
No water potential data found
No TZ Grass Biomass data found
No TZ OakLeaves Biomass data found
No TZ PineNeedles Biomass data found
0 photos found
16 sets found
No data found for TZ_Fenergy.
11 TZ_tmet graphs found


No data found for TZ_soilco2.
Can't check TZ_mixed
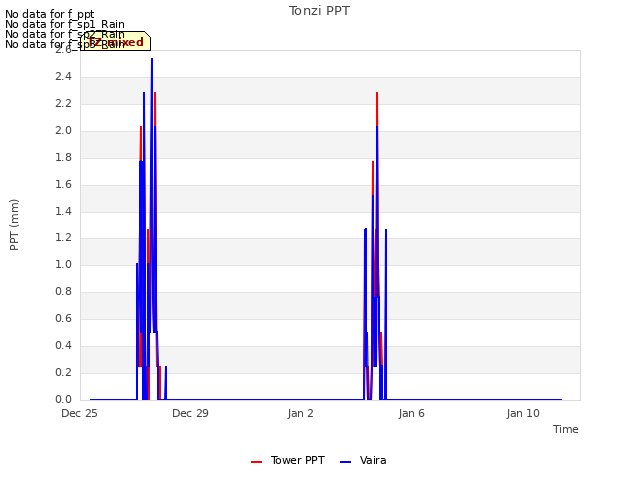
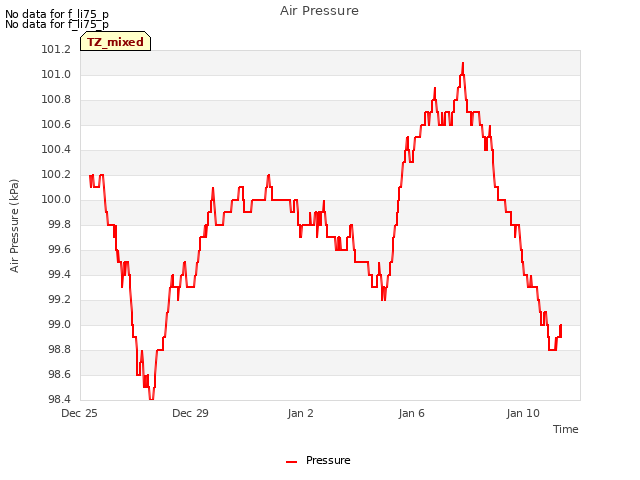
3 TZ_mixed graphs found

No data found for TZ_fflux.
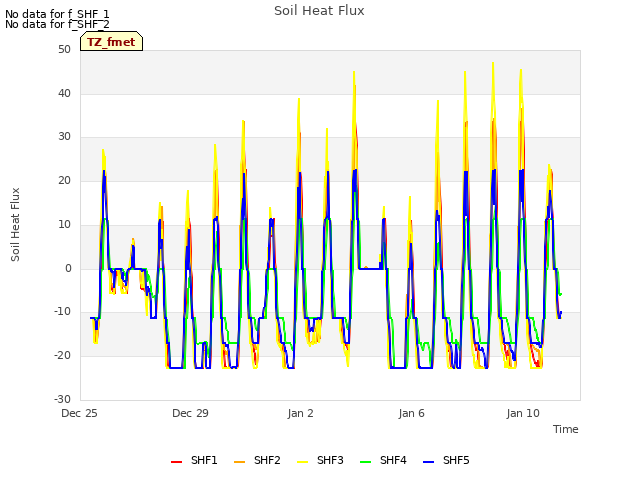
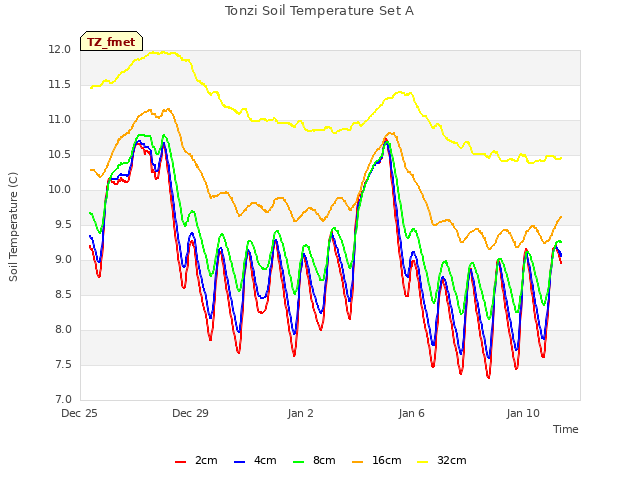
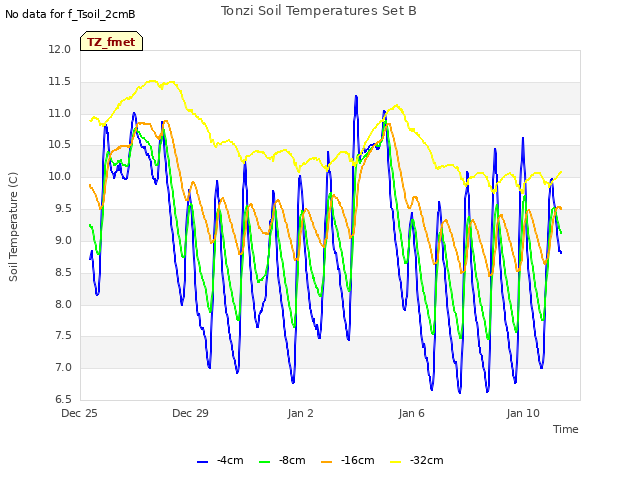
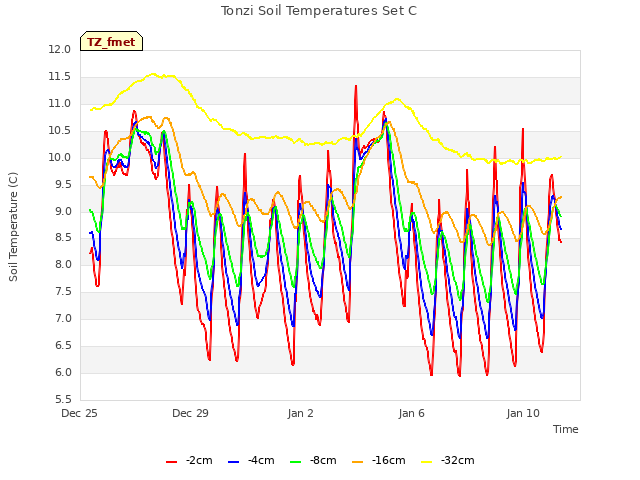
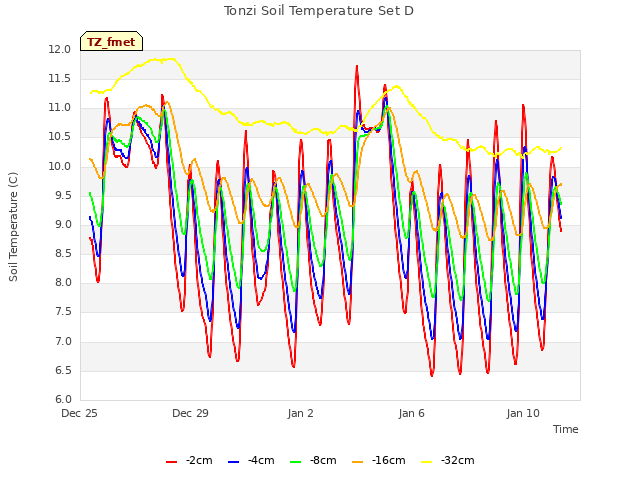
8 TZ_fmet graphs found


No data found for TZ_tram.
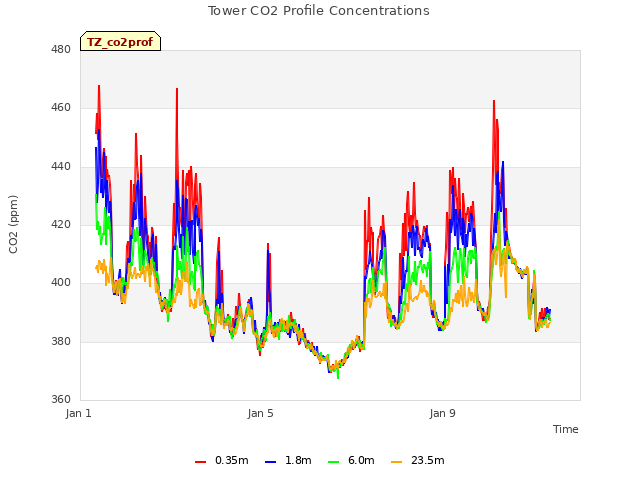
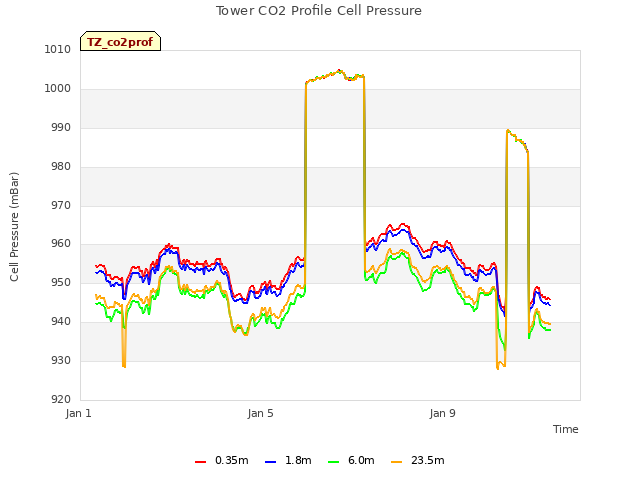
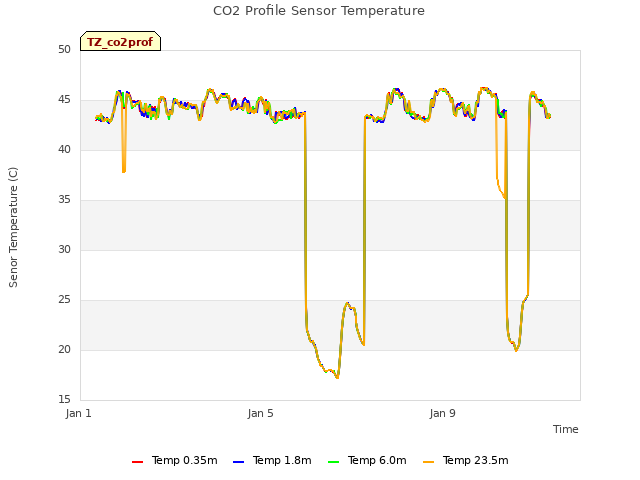
3 TZ_co2prof graphs found
No data found for TZ_irt.
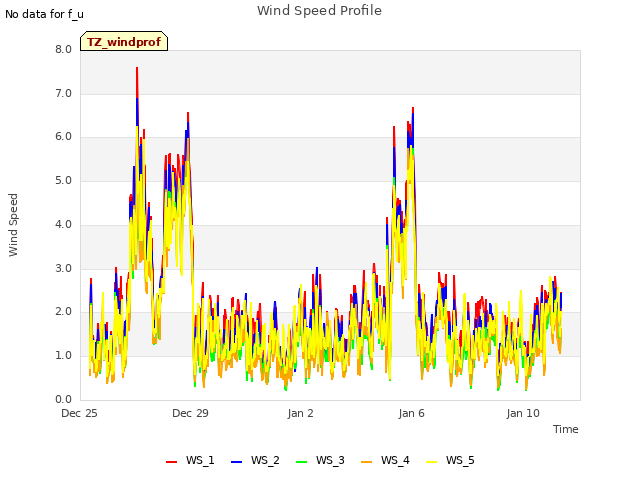
1 TZ_windprof graphs found
No data found for TZ_tflux.
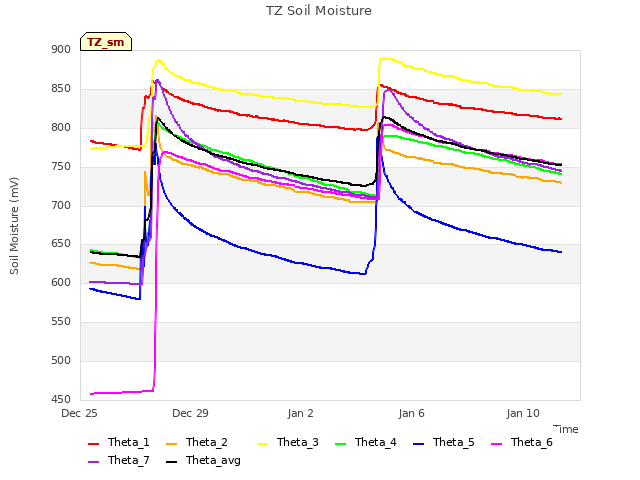
2 TZ_sm graphs found

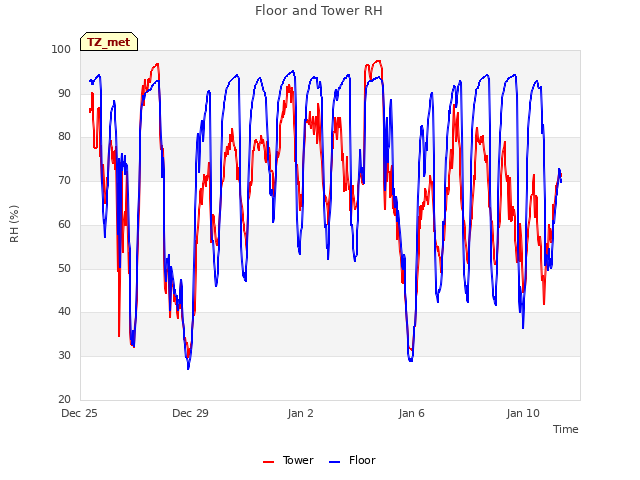
Can't check TZ_met
1 TZ_met graphs found
Can't check TZVR_mixed
No data found for TZ_osu.
No data found for TZ_fd.
Tonzi Z-cam data


