Field Notes
<--2007-01-10 00:00:00 |
2007-02-04 11:30:00-->
Phenocam link:
Searching...Tonzi: 2007-01-19 09:30:00 (DOY 19)
Author: Siyan Ma
Others: Ted
When: Date: 1/19/2007 , Day:
19 ,
Watch Time: 9:30am .
Where: Tonzi/Vaira Ranch
Who: Siyan (met Ted at Tonzi)
Weather:
partially cloudy
Phenology:
grass didn’t grow very much at both sites.
Grass at Tonzi looks yellow-green.
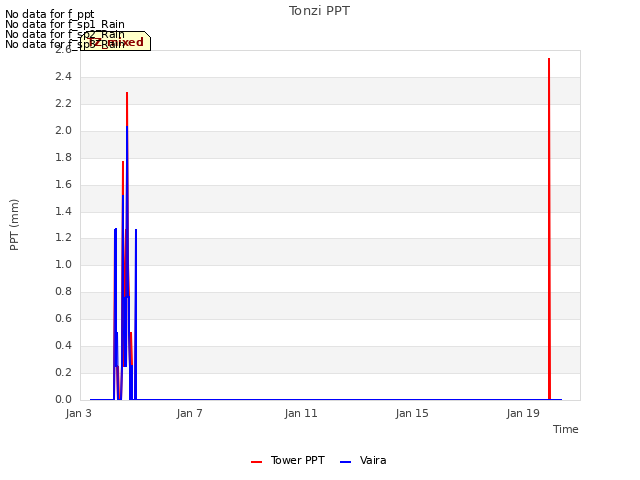
This is a dry winter.
Summary
- Ted saw “BLUE SCREEN DEATH” at Tower site. We lost raw data during Day 11-18.
- swapped Li-7500 at Tower, Floor, and Vaira. Water and CO2 channels all worked
well. The failure in calibrating
water channel resulted from the dead descant.
- PC clock at Tower is only 1 sec behind GPS. Correcting PC and dataloggers time at
Floor.
- Power on Floor site is OK.
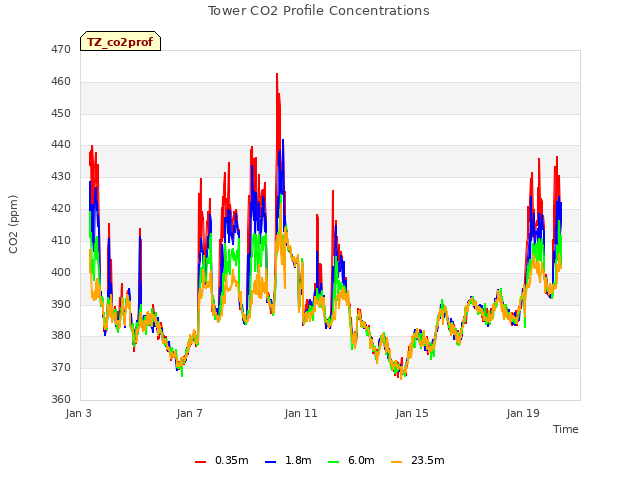
- Soil CO2 profile
worked well.
- dendrometer, soil moisture, and
spectrume were measured.
Dendrometers need reset because some have been out of range!!!
- Spectrometer data have sent
to Youngryel for processing.
Vaira_Grass
Site
- Fence and gate power: >12 v.
- Panel and Batteries: 13.2 v; 7.4
amps; 2.7 amps.
- Reading from Gillsonic screen
before downloading data. (The value
of H2O and CO2 should be in the range of 0 – 5 v.)
Time
|
12:39:59
|
Path/File name
|
D:\Data\V07_019 .flx
D:\Data\VR070191200.raw
|
|
mean
|
std
|
|
mean
|
std
|
w
|
0.23
|
0.25
|
Ts
|
14.37
|
0.68
|
u
|
-1.61
|
0.71
|
H2O
|
1.31
|
0.054
|
v
|
2.61
|
0.56
|
CO2
|
2.23
|
0.025
|
|
|
|
TC
|
0.835
|
0.067
|
- downloading data OK
- swaping Li-7500:
remove SN# 73 and install SN# 41.
- Closed gate and set up fence.
Tonzi_Tower Site
- Ted saw “BLUE SCREEN DEATH” at Tower site. We lost raw data during Day 11-18.
- Ted will take away Li-cor PAR sensors and connect KZ PAR UP and DN
to normal PAR channels. Change is
needed in flux.cpp.
- Fence and gate power: >12 v.
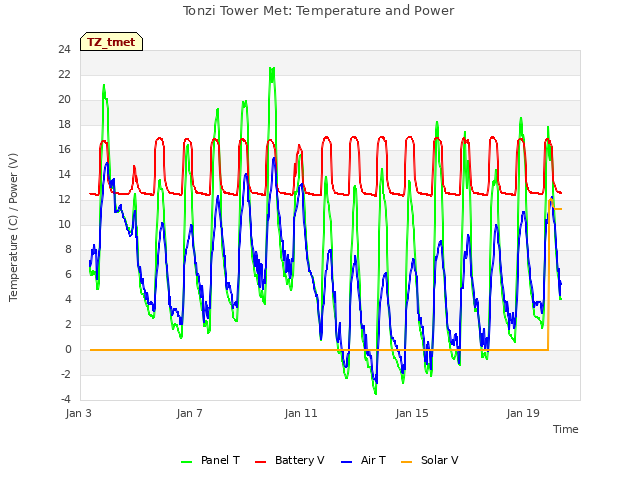
- Panel and Batteries: 13.7
v; 0.0 amps; 4.8
amps.
- Reading from Gillsonic screen
before downloading data. (The value
of H2O and CO2 should be in the range of 0 – 5 v.)
Time
|
9:38:49
|
Path/File name
|
D:\Data\T07_019 .flx
D:\Data\TW070190900.raw
|
|
mean
|
std
|
|
mean
|
std
|
w
|
-0.06
|
0.54
|
Ts
|
11.205
|
0.471
|
u
|
-2.6
|
0.47
|
H2O
|
1.636
|
0.049
|
v
|
2.16
|
1.37
|
CO2
|
2.25
|
0.027
|
- downloading data OK
- swaping Li-7500: remove SN#
976 and install SN# 65.
- PC time was about one second difference from GPS. No correction was taken.
- check the fans of air temp.
and relative humidity sensors on the tower and the floor.
- Check calibration cylinders;
CO 2 1400 psig; flow 18
psi.
N 2 1300
psig; flow 20 psi.
Manually calibrate Li-800. Following Ted’s instruction: H:\IoneSavanna_2004\Tower_2004\CO2Profile\LI800_Calibration_Procedure_2Nov04.txt
Is the pump running OK
- close gate and set up fence. OK
Toniz_Floor
Site
- Fence and gate power: 12
v.
- Panel and Batteries: 13.8 v; 15.7 amps; 2.0 amps.
- Reading from Gillsonic screen
before downloading data. (The value
of H2O and CO2 should be in the range of 0 – 5 v.)
Time
|
10:44:22
|
Path/File name
|
D:\Data\F06_ 018 .flx
D:\Data\FL06 0181730 .raw
|
|
mean
|
std
|
|
mean
|
std
|
w
|
0.65
|
0.213
|
Ts
|
12.9
|
0.428
|
u
|
0.89
|
0.54
|
H2O
|
1.8
|
0.054
|
v
|
1.79
|
1.09
|
CO2
|
2.118
|
0.036
|
- downloading data: OK
- swaping Li-7500: remove SN#
418 and install SN# 35.
- Check MD-9 system connections:
OK
CR23X3 – floor-Met
CR23X5 – soil CO 2
profile
CR23X6 – tower-Met
CR10X2 – floor-Met
CR10X4 – sap-flow
CR10X7 – CO 2 profile
CR10X8 – wind profile
CR1021 – Xingyuan’s sap flow =>Ted
saw -6999 values.
- Soil CO2 profile
Reading
from datalogger
Panel
temp
|
16.29
|
|
|
Battery
voltage
|
13.81
|
|
|
CO2E_1
|
445
|
TCE_1
|
10.6
|
CO2W_1
|
526
|
TCW_1
|
11.3
|
CO2E_2
|
608
|
TCE_2
|
12.3
|
CO2W_2
|
741
|
TCW_2
|
8.9
|
CO2E_3
|
719
|
TCE_3
|
6.9
|
CO2W_3
|
1199
|
TCW_3
|
8.6
|
CO2E_4
|
895
|
TCE_4
|
4.9
|
CO2W_4
|
1697
|
TCW_4
|
8.9
|
- soil moisture (TDR)
tonzi
|
7931AFE
|
402165
|
574B4B
|
402FF3
|
574632
|
7A432E
|
7A3C6E
|
7A3B40
|
7A4AAA
|
19-Jan-07
|
19
|
|
|
|
|
|
|
|
|
|
SM
|
|
|
|
|
|
|
|
|
0-15
|
19.9
|
18.8
|
38.2
|
20.9
|
25.8
|
21.7
|
22.6
|
19.7
|
12.4
|
15-30
|
23.9
|
30.1
|
34.4
|
30.1
|
32.6
|
17.3
|
28.6
|
30.1
|
10.6
|
30-45
|
20.4
|
19.8
|
39.9
|
37.1
|
41.9
|
19.3
|
27.6
|
31.3
|
22.1
|
45-60
|
16.7
|
7.3
|
50.0
|
39.1
|
41.4
|
18.8
|
38.0
|
38.2
|
12.2
|
|
|
|
|
|
|
|
|
|
|
|
A6D882B
|
A3D04E8
|
A6D72F5
|
|
|
|
|
|
|
|
|
|
|
|
|
|
|
|
|
0-15
|
31.7
|
27.0
|
14.7
|
|
|
|
|
|
|
15-30
|
22.2
|
25.2
|
28.9
|
|
|
|
|
|
|
30-45
|
31.3
|
32.1
|
31.8
|
|
|
|
|
|
|
45-60
|
36.0
|
45.4
|
42.0
|
|
|
|
|
|
|
|
|
|
|
|
|
|
|
|
|
vaira
|
57318a
|
7933dee
|
|
|
|
|
|
|
|
0-15
|
15.6
|
20.5
|
|
|
|
|
|
|
|
15-30
|
26.7
|
30.9
|
|
|
|
|
|
|
|
30-45
|
28.8
|
30.3
|
|
|
|
|
|
|
|
45-60
|
31.1
|
36.4
|
|
|
|
|
|
|
|
- Close gate and set up fence.
Tonzi
|
|
|
|
Dendrometer
|
|
|
|
|
|
|
Date
|
Day
|
Tag #
|
Reading (cm)
|
1/19/2007
|
19
|
71
|
22.7
|
|
|
72
|
23.5
|
|
|
77
|
Broken
|
|
|
78
|
Broken
|
|
|
79
|
23.4
|
|
|
245
|
22.6
|
|
|
248
|
Out of range
|
|
|
250
|
21.8
|
|
|
255
|
22.1
|
|
|
252
|
missing
|
|
|
102
|
Broken
|
|
Field Data
No tank data
No TZ Well data found
No TZ Moisture Point data found
No VR Moisture Point data found
No TZ grass heigth found
No VR grass heigth found
No TZ Tree DBH found
No water potential data found
No TZ Grass Biomass data found
No TZ OakLeaves Biomass data found
No TZ PineNeedles Biomass data found
0 photos found
16 sets found
No data found for TZ_Fenergy.
11 TZ_tmet graphs found


No data found for TZ_soilco2.
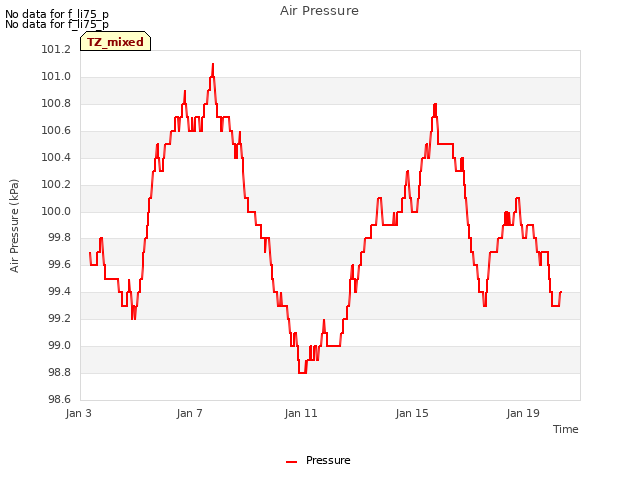
Can't check TZ_mixed
3 TZ_mixed graphs found

No data found for TZ_fflux.
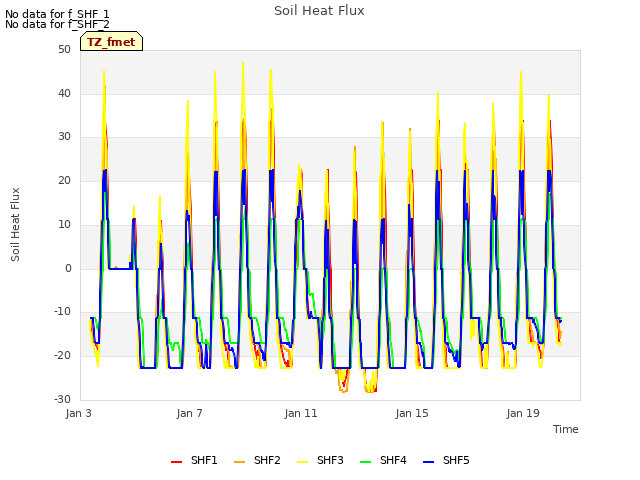
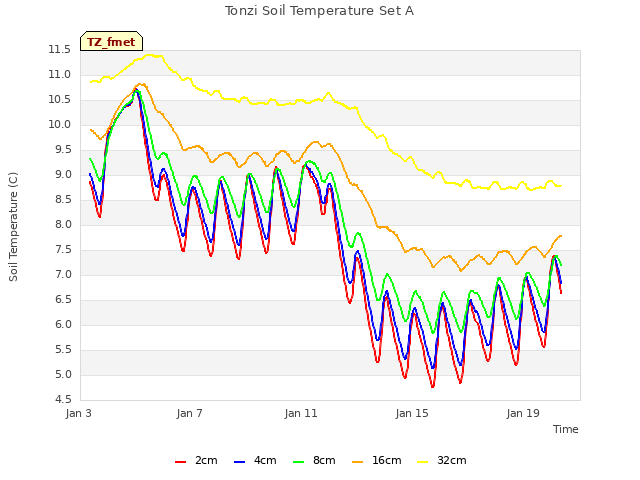
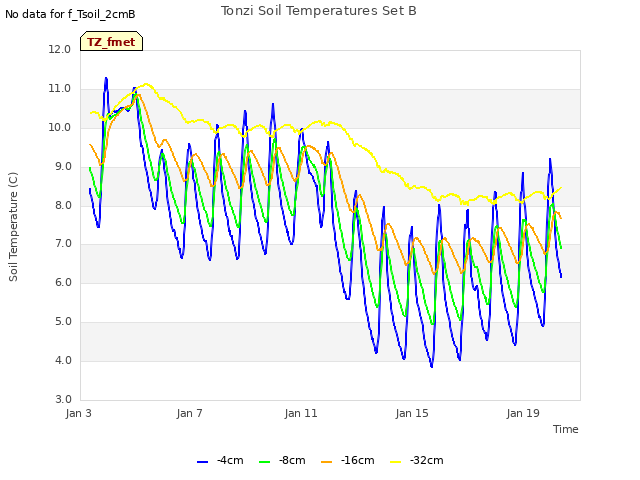
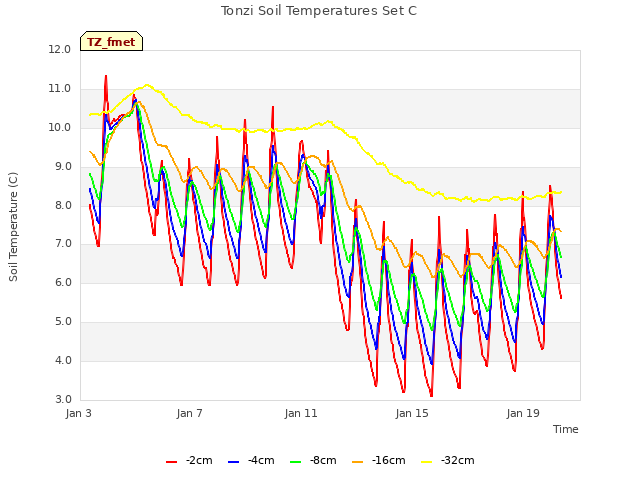
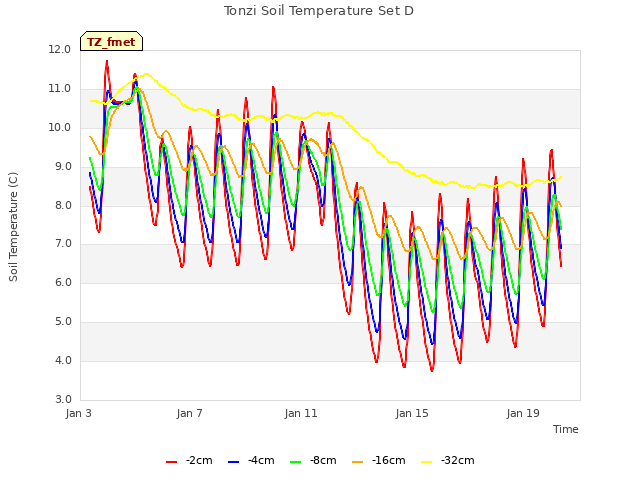
8 TZ_fmet graphs found


No data found for TZ_tram.
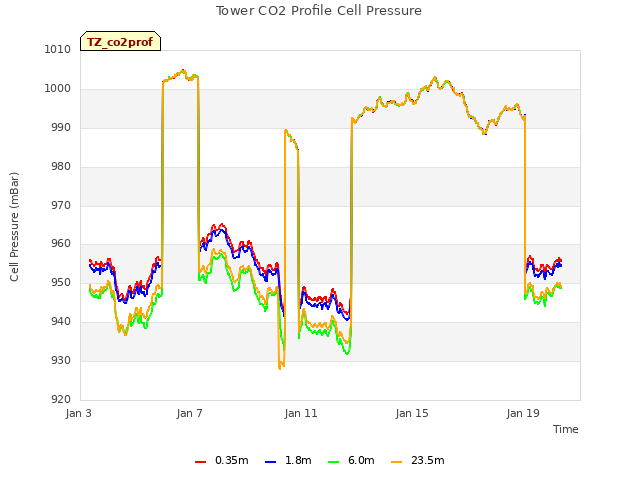
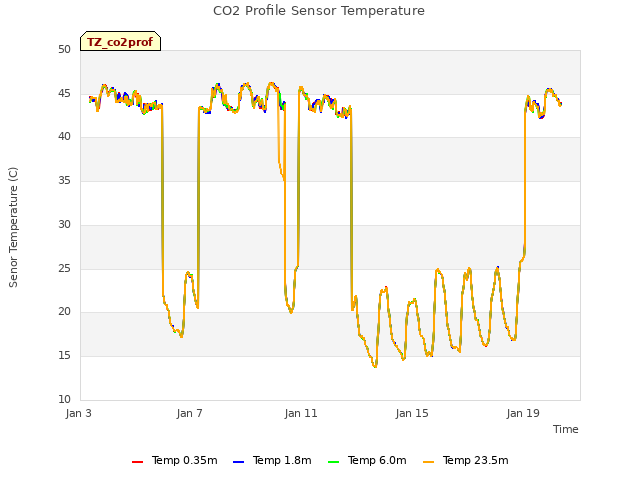
3 TZ_co2prof graphs found
No data found for TZ_irt.
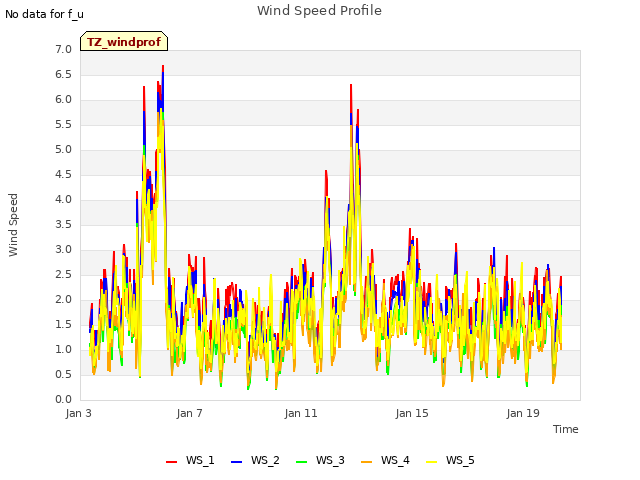
1 TZ_windprof graphs found
No data found for TZ_tflux.
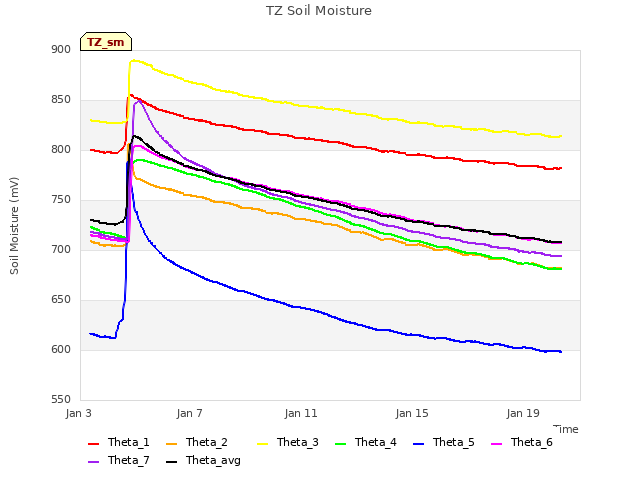
2 TZ_sm graphs found

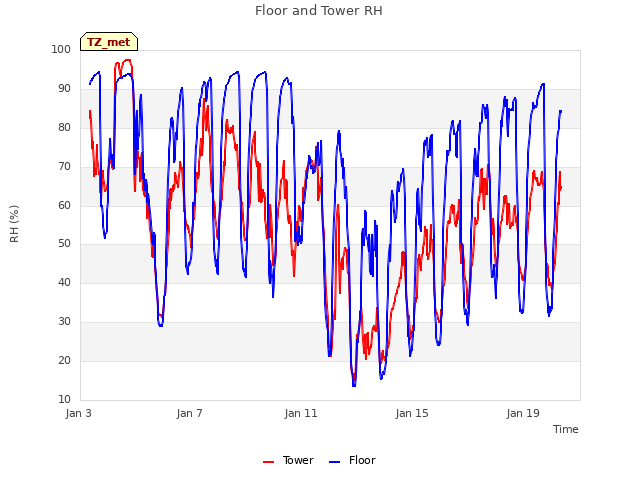
Can't check TZ_met
1 TZ_met graphs found
Can't check TZVR_mixed
No data found for TZ_osu.
No data found for TZ_fd.
Tonzi Z-cam data


