
Field Notes
<--2009-05-27 10:30:00 | 2009-06-12 09:30:00-->Phenocam link: Searching...
Twitchell Rice: 2009-06-04 10:00:00 (DOY 155)
Author: Joe Verfaillie
Others: Abhinav, Matteo
Summary: Field flooded, run LGR on generator, solar panels and batteries from Steve Deverel.
| Twitchell
6/4/2009 Arrived about 10am with Abhinav Guha (Allen Goldstein lab). Matteo arrive a little later, about 11am. Clear, cool, windy. Fields were flooded a few days ago. Standing water in most areas. The well is not full though, seems like it is taking a long time for the water to percolate up from the bottom. I guess we probably should have perforated the sides of the pipe. Road are in good shape and passable by cars. The goal today was to run the LGR CH4 analyzer. We borrowed a 1kW Honda generator from Jim. External diaphragm pump was in a Campbell enclosure and connected to the analyzer with the 6’ (183cm) tubing (3/8” ID) provided by LGR. The inlet positioned at the height of the sonic and IRGA paths, faced down wind and was connected to a 40um Swagelok filter with 20” (51cm) of tubing (1/4” ID). Another 131” (333cm) of tubing ran from the filter to the inlet on the analyzer. In adjusting the high flow bypass value, we discovered that sunlight inside the analyzer case disrupts the measurements railing the CH4 to 0 ppm and ringtime to 25.000 usec. I had to fashion a RS232 cable to connect the analyzer to the CR1000 from some thermocouple wire because I forgot to bring a serial cable. Then the CR1000 program was having trouble parsing the data string. About two hours of good data was recorded before the generator ran out of gas. Also at visiting the field that day were Frank and three other UCD people, Cynthia (UCD) and another doing field measurements, and Steve Deverel and some others. Steve brought six 50W solar panels and three 265 Amp-hr batteries for our use. |
6 photos found
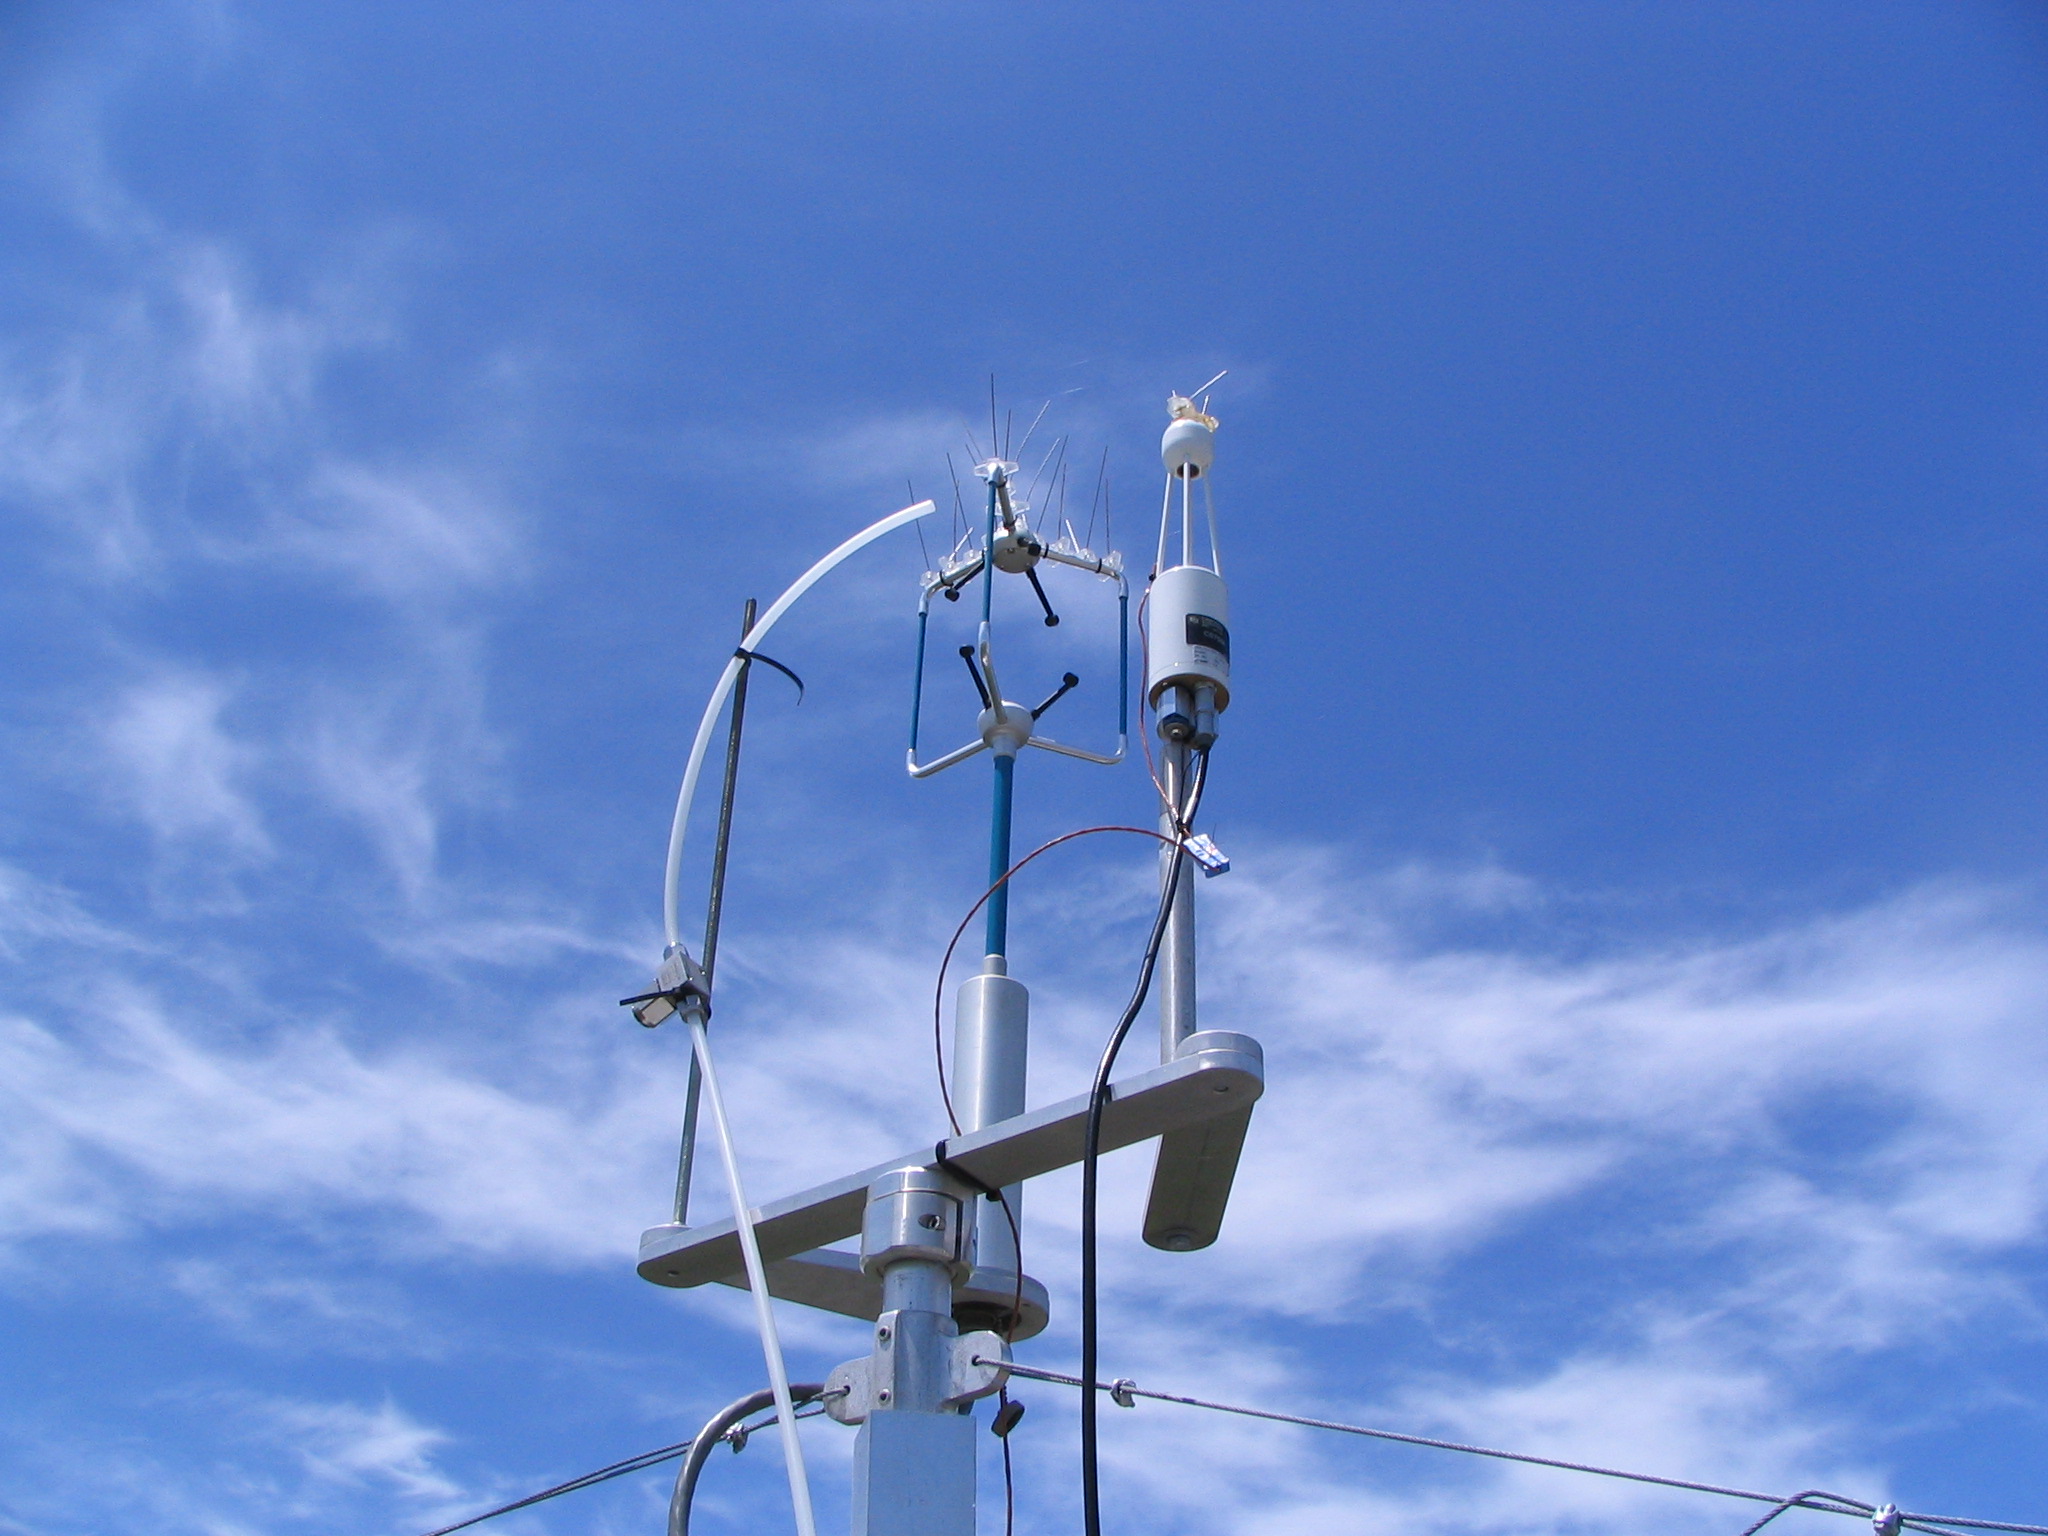
20090604TW_LGRInlet.jpg ( 2009-06-04 13:17:01 ) Full size: 2048x1536
Eddy sensors and LGR inlet tubing
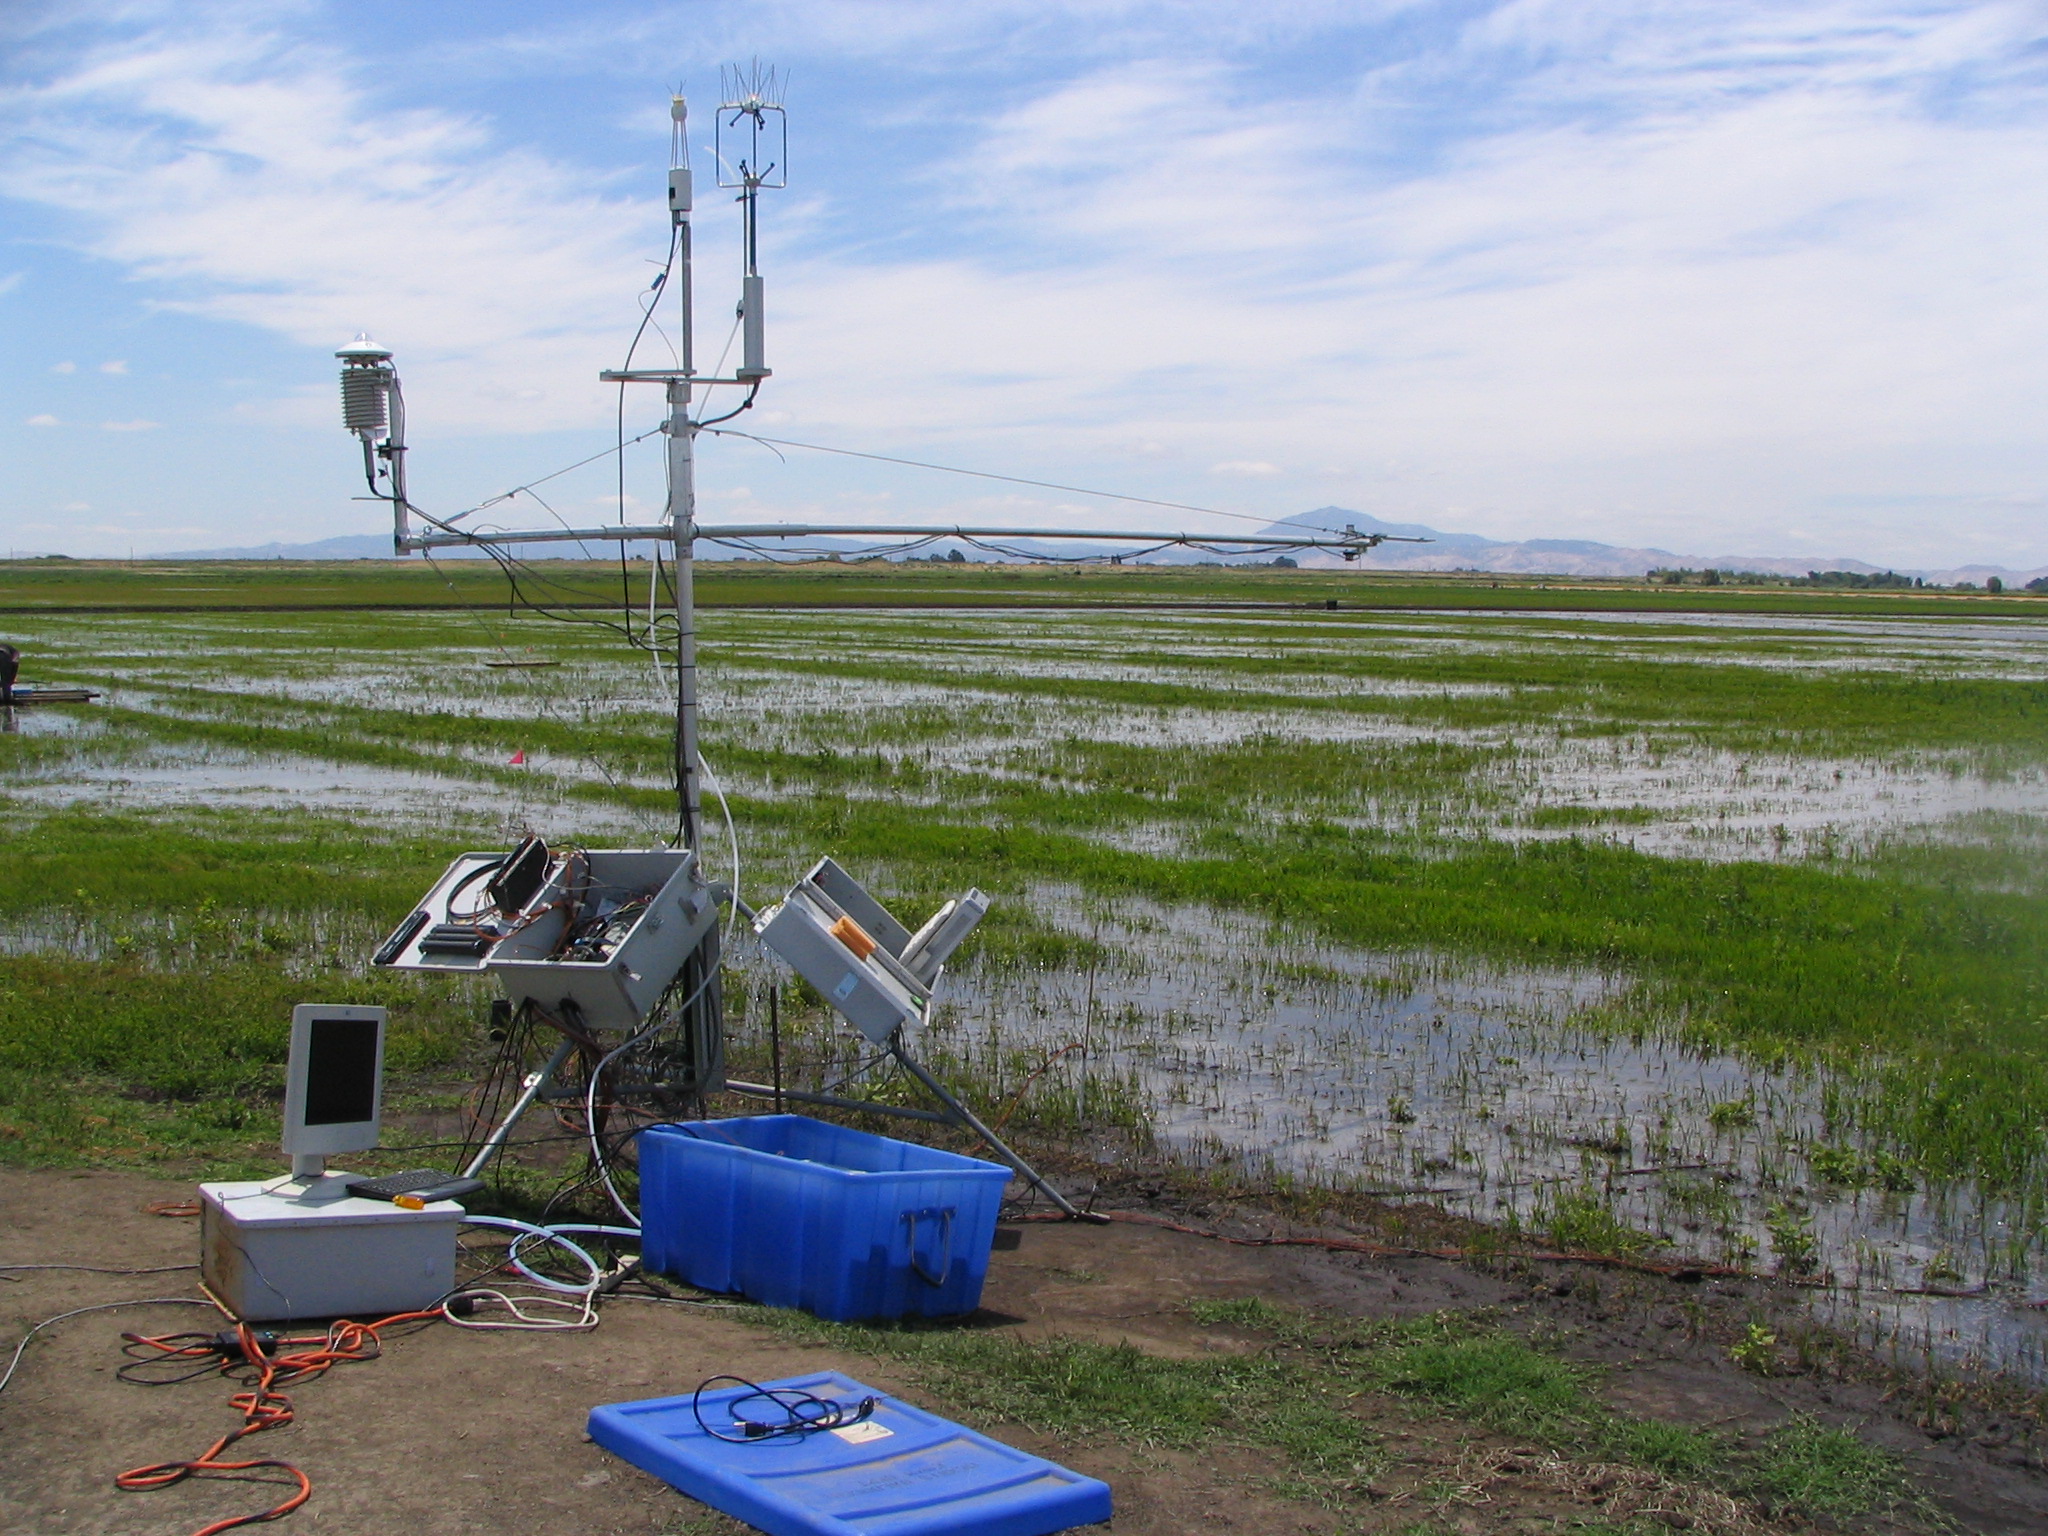
20090604TW_TowerLGR1.jpg ( 2009-06-04 13:04:55 ) Full size: 2048x1536
Eddy tower at rice field with LGR running
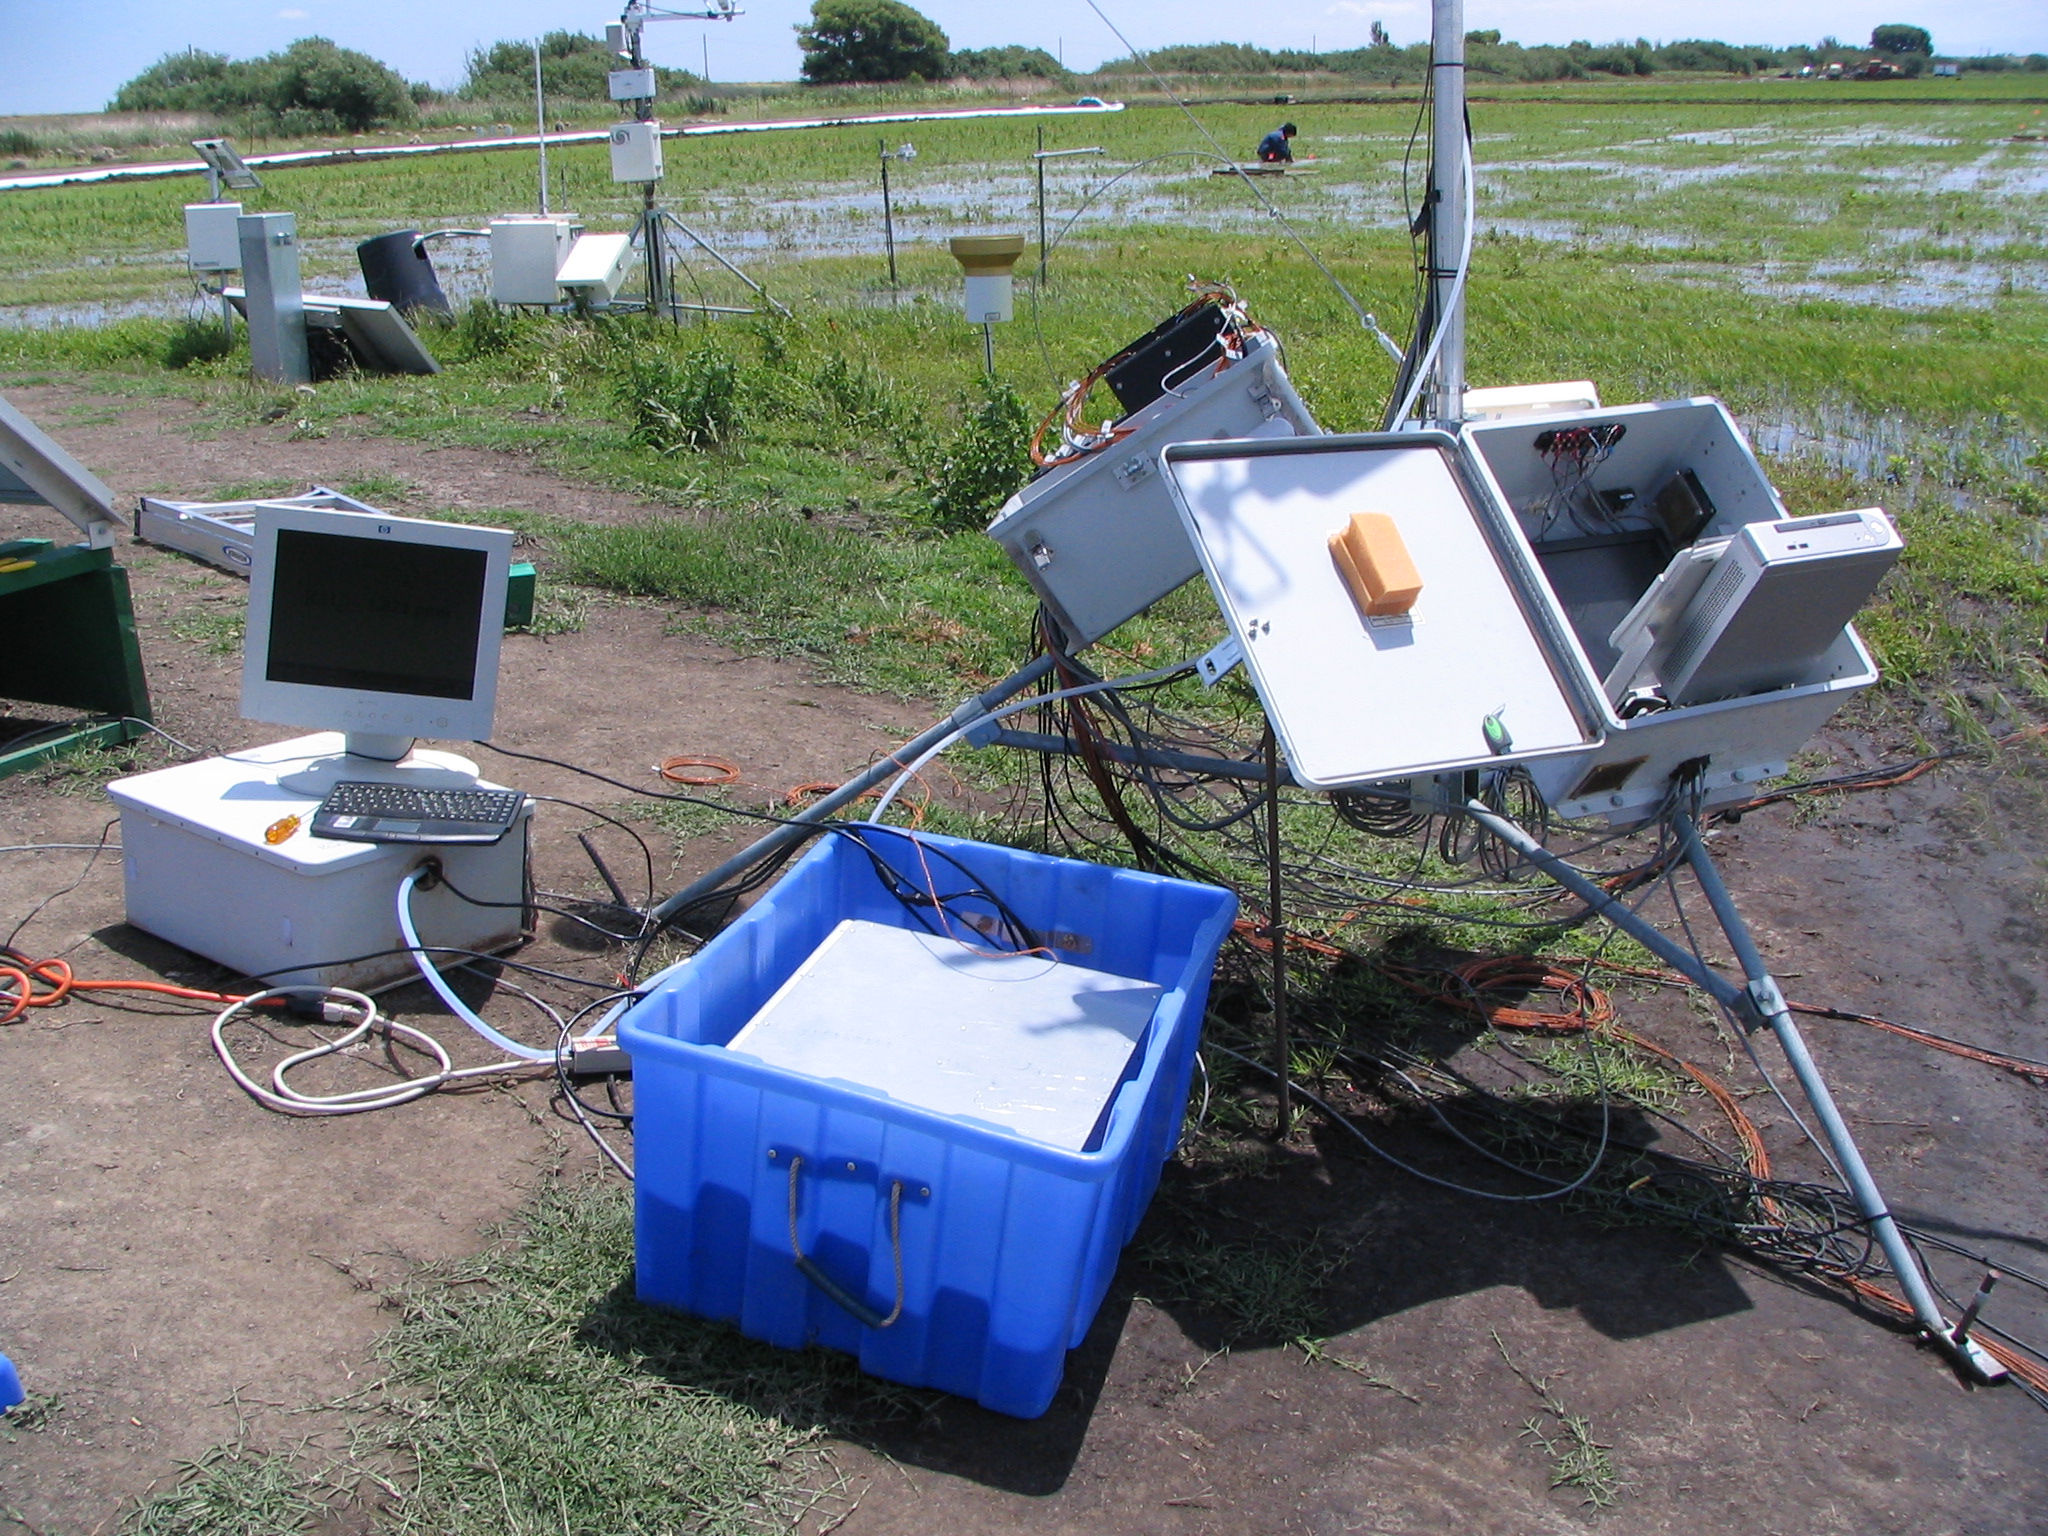
20090604TW_TowerLGR2.jpg ( 2009-06-04 13:05:45 ) Full size: 2048x1536
Eddy tower at rice field with LGR running
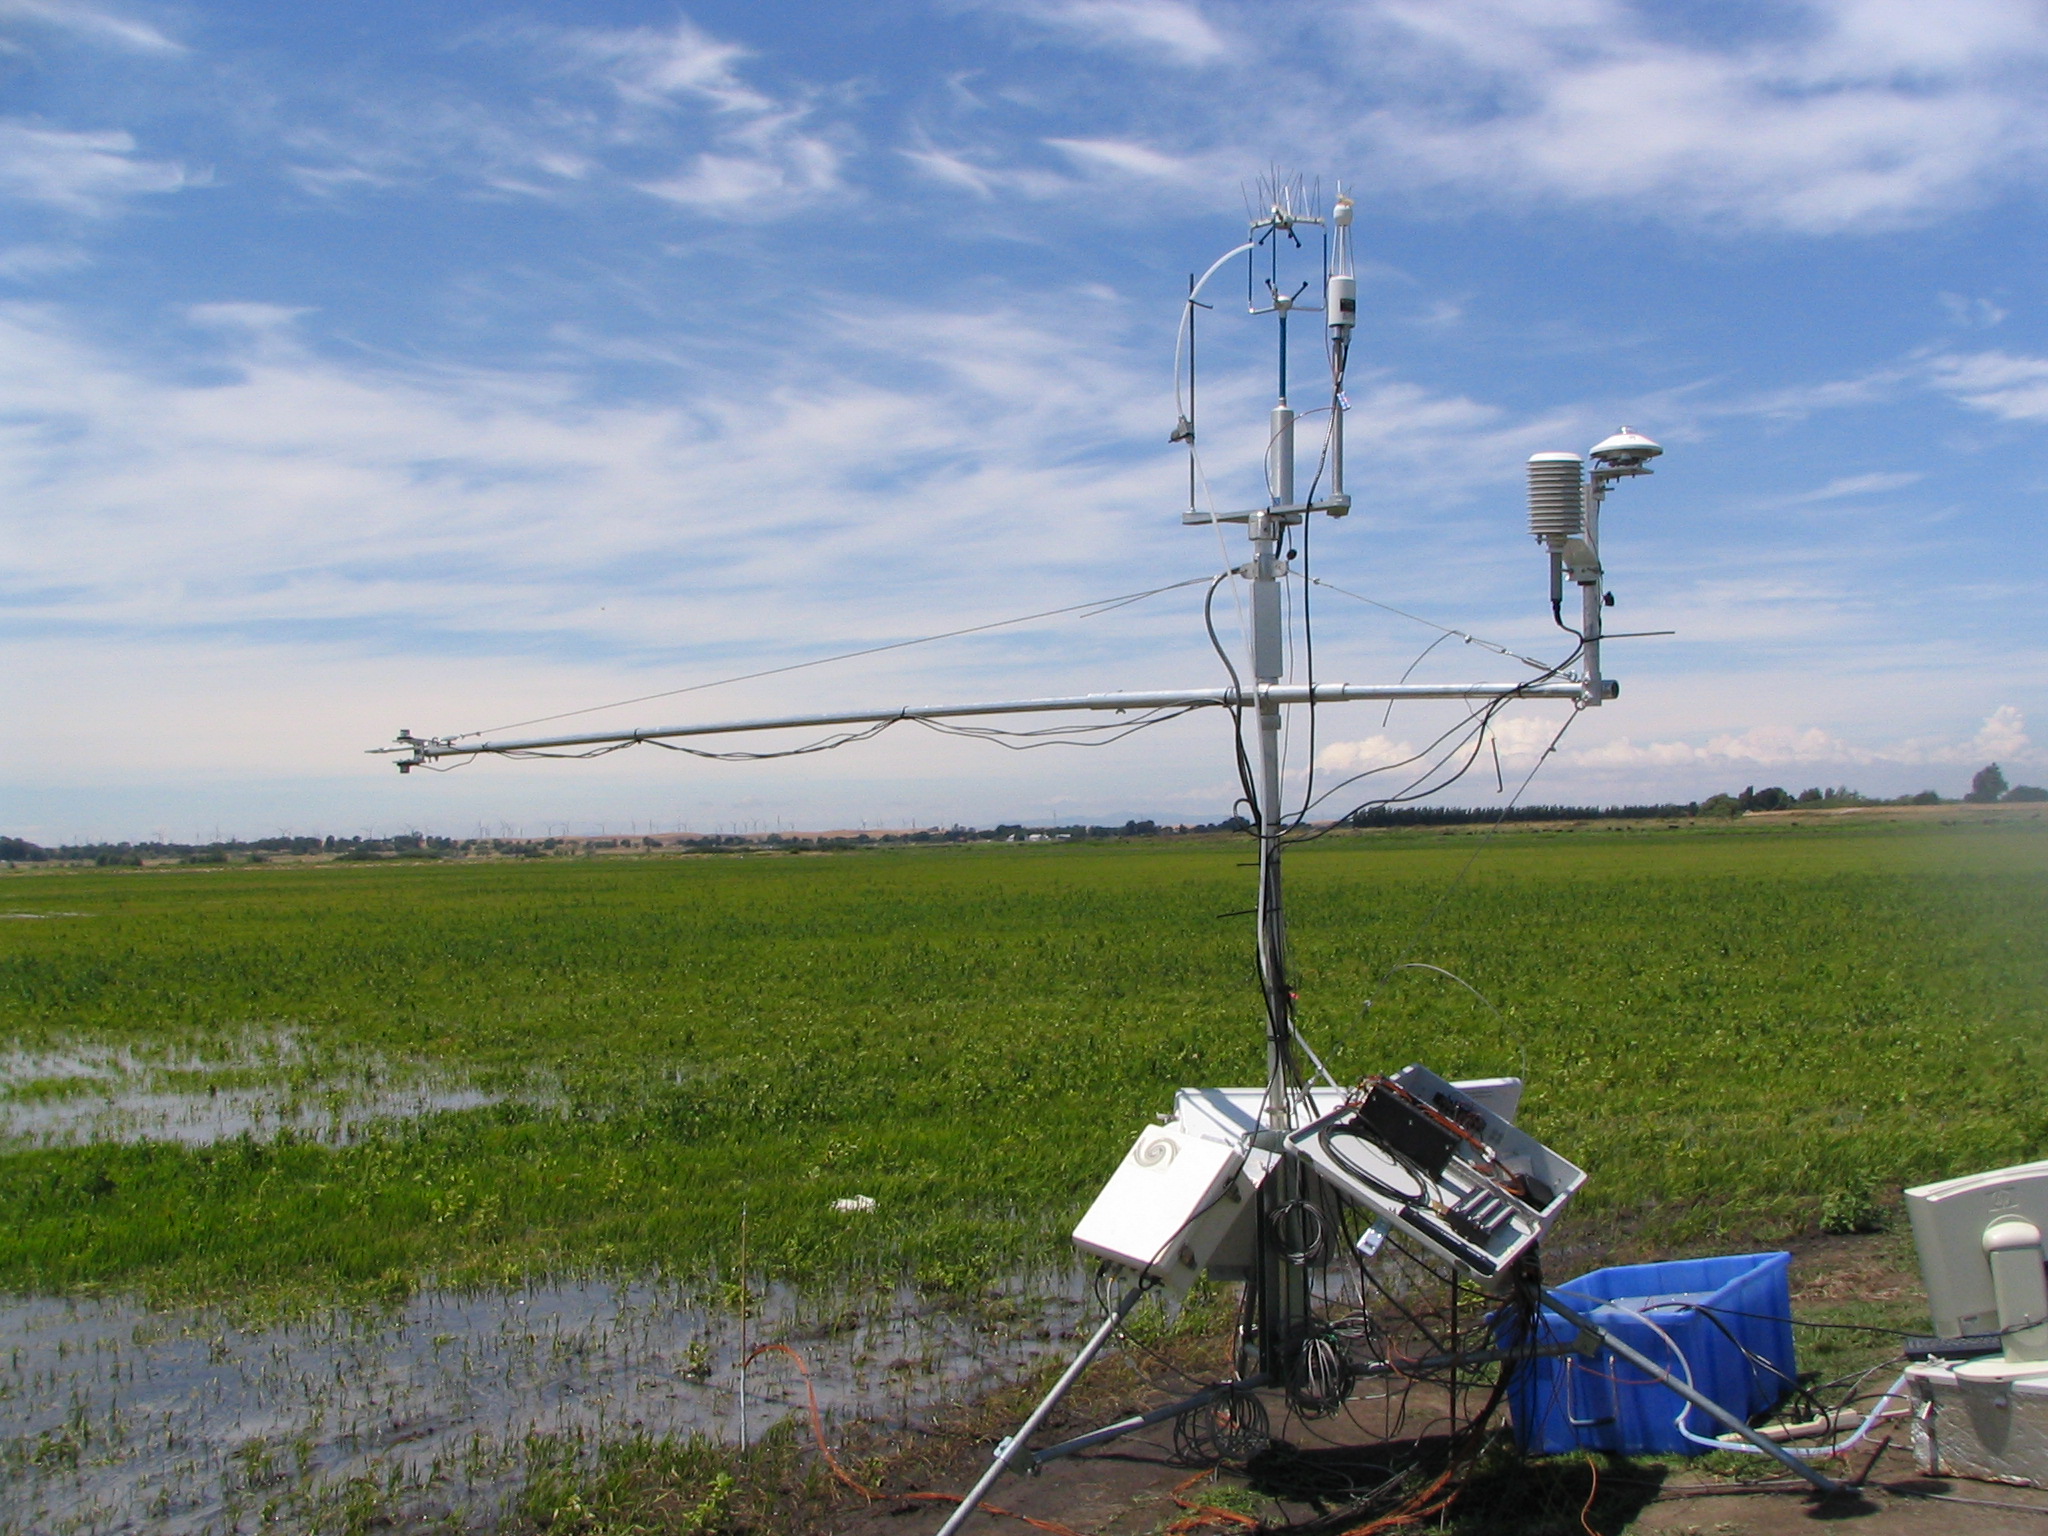
20090604TW_TowerLGR3.jpg ( 2009-06-04 13:16:48 ) Full size: 2048x1536
Eddy tower at rice field with LGR running
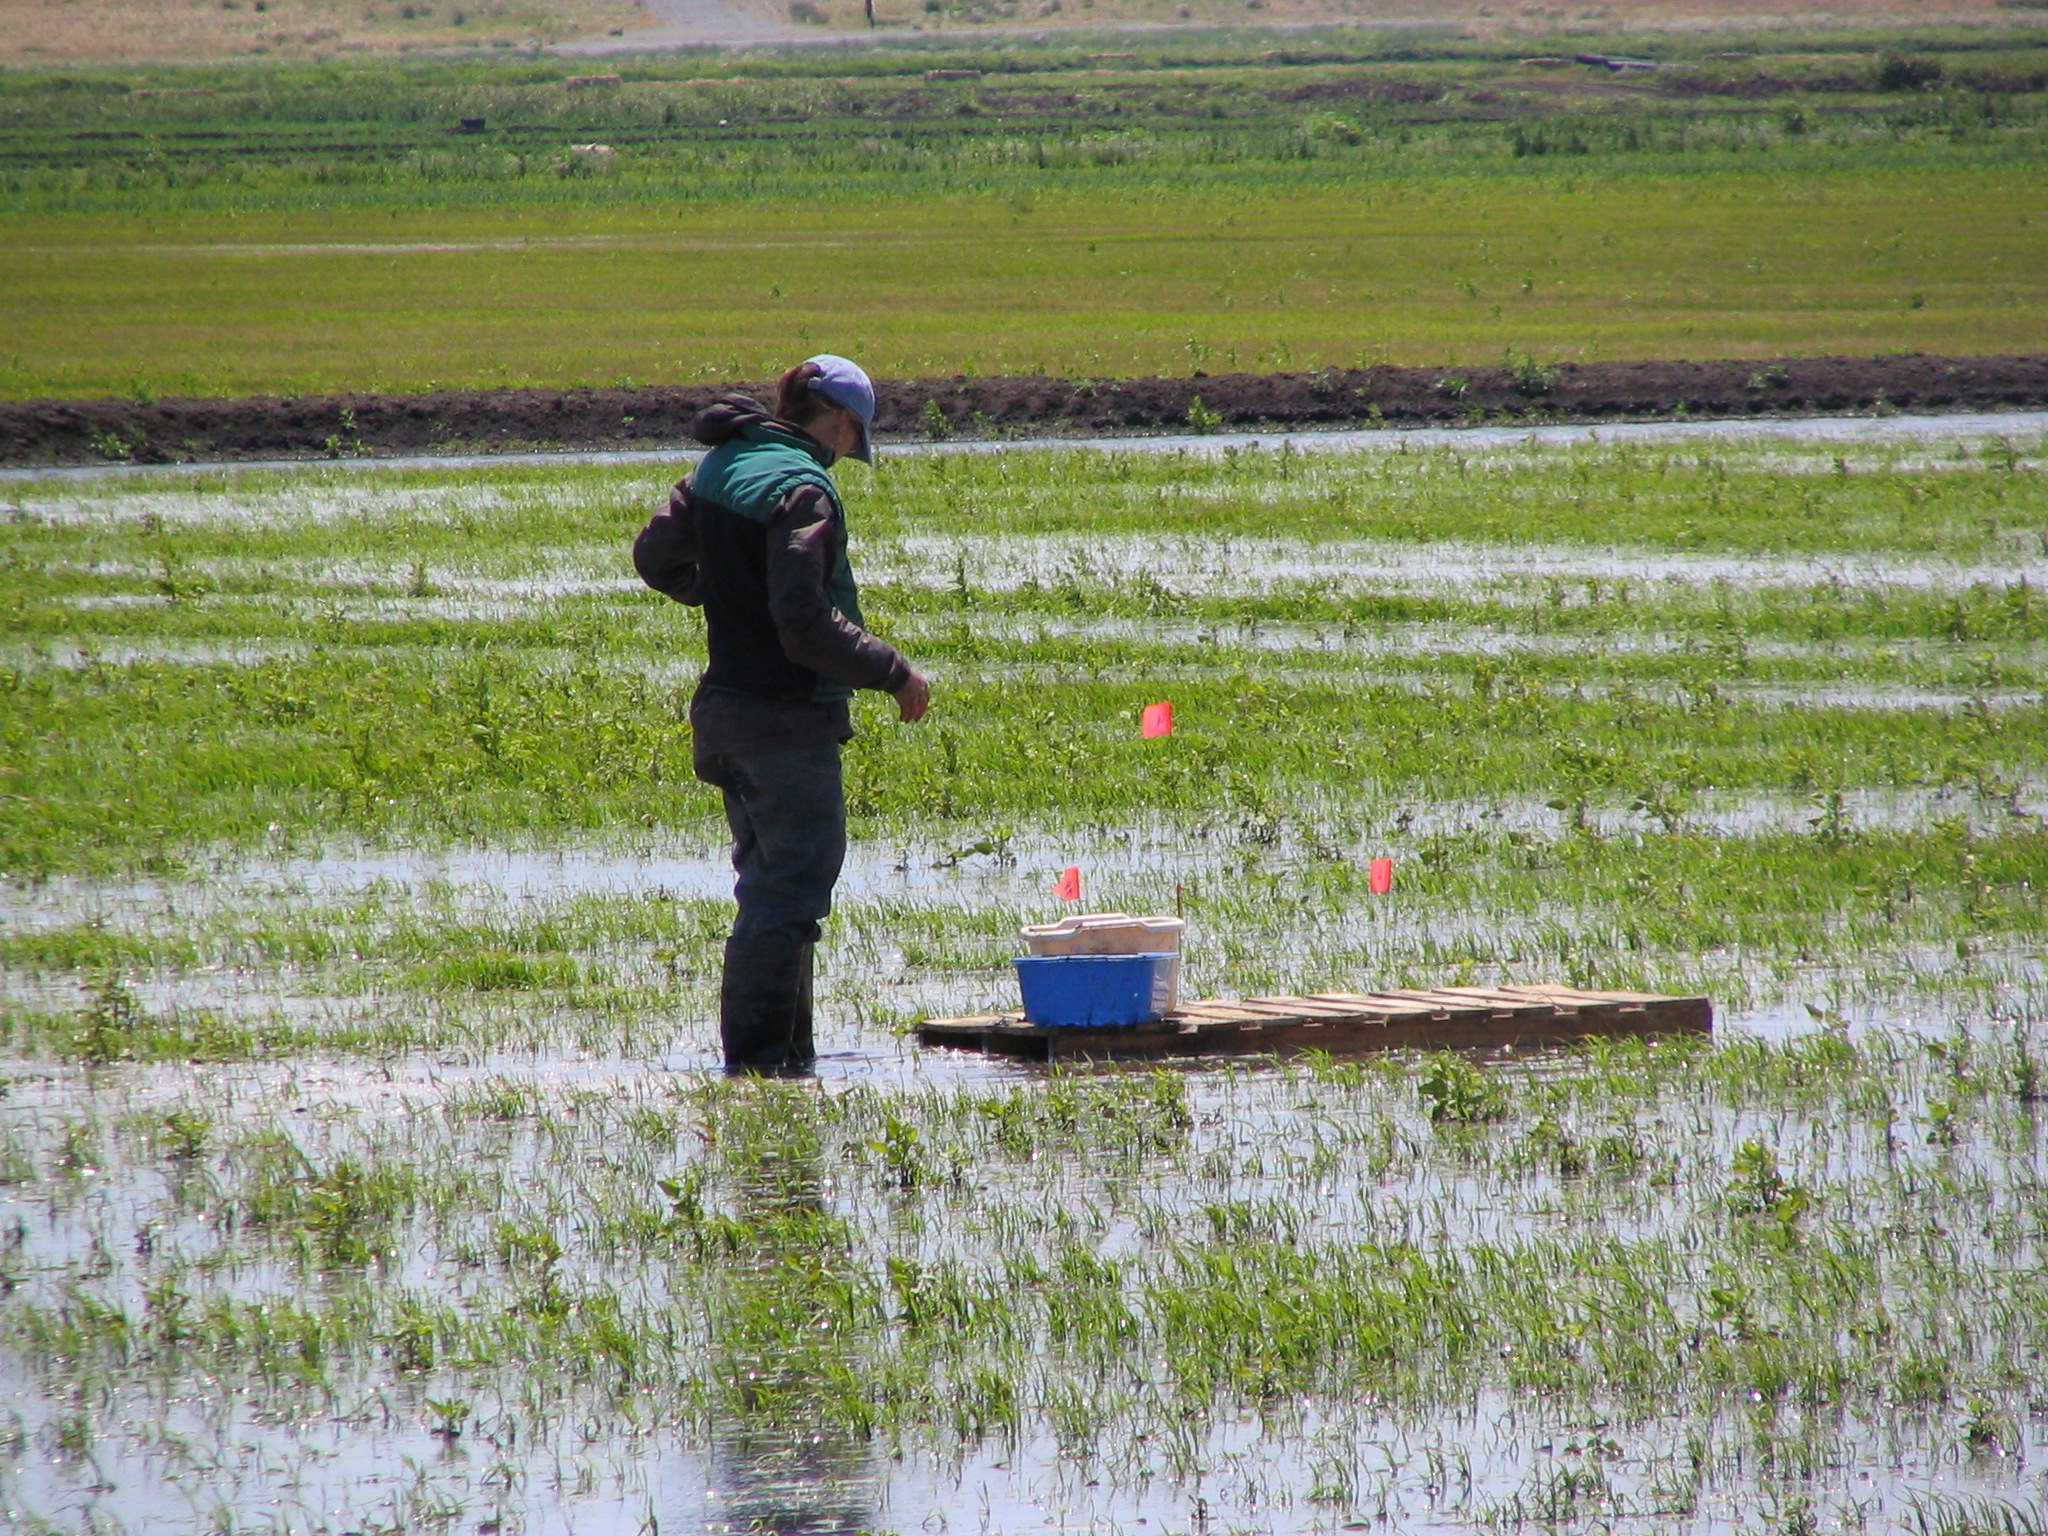
20090604TW_UCDCynthia.jpg ( 2009-06-04 13:16:13 ) Full size: 2048x1536
UC Davis student doing chamber measurements in the rice paddy
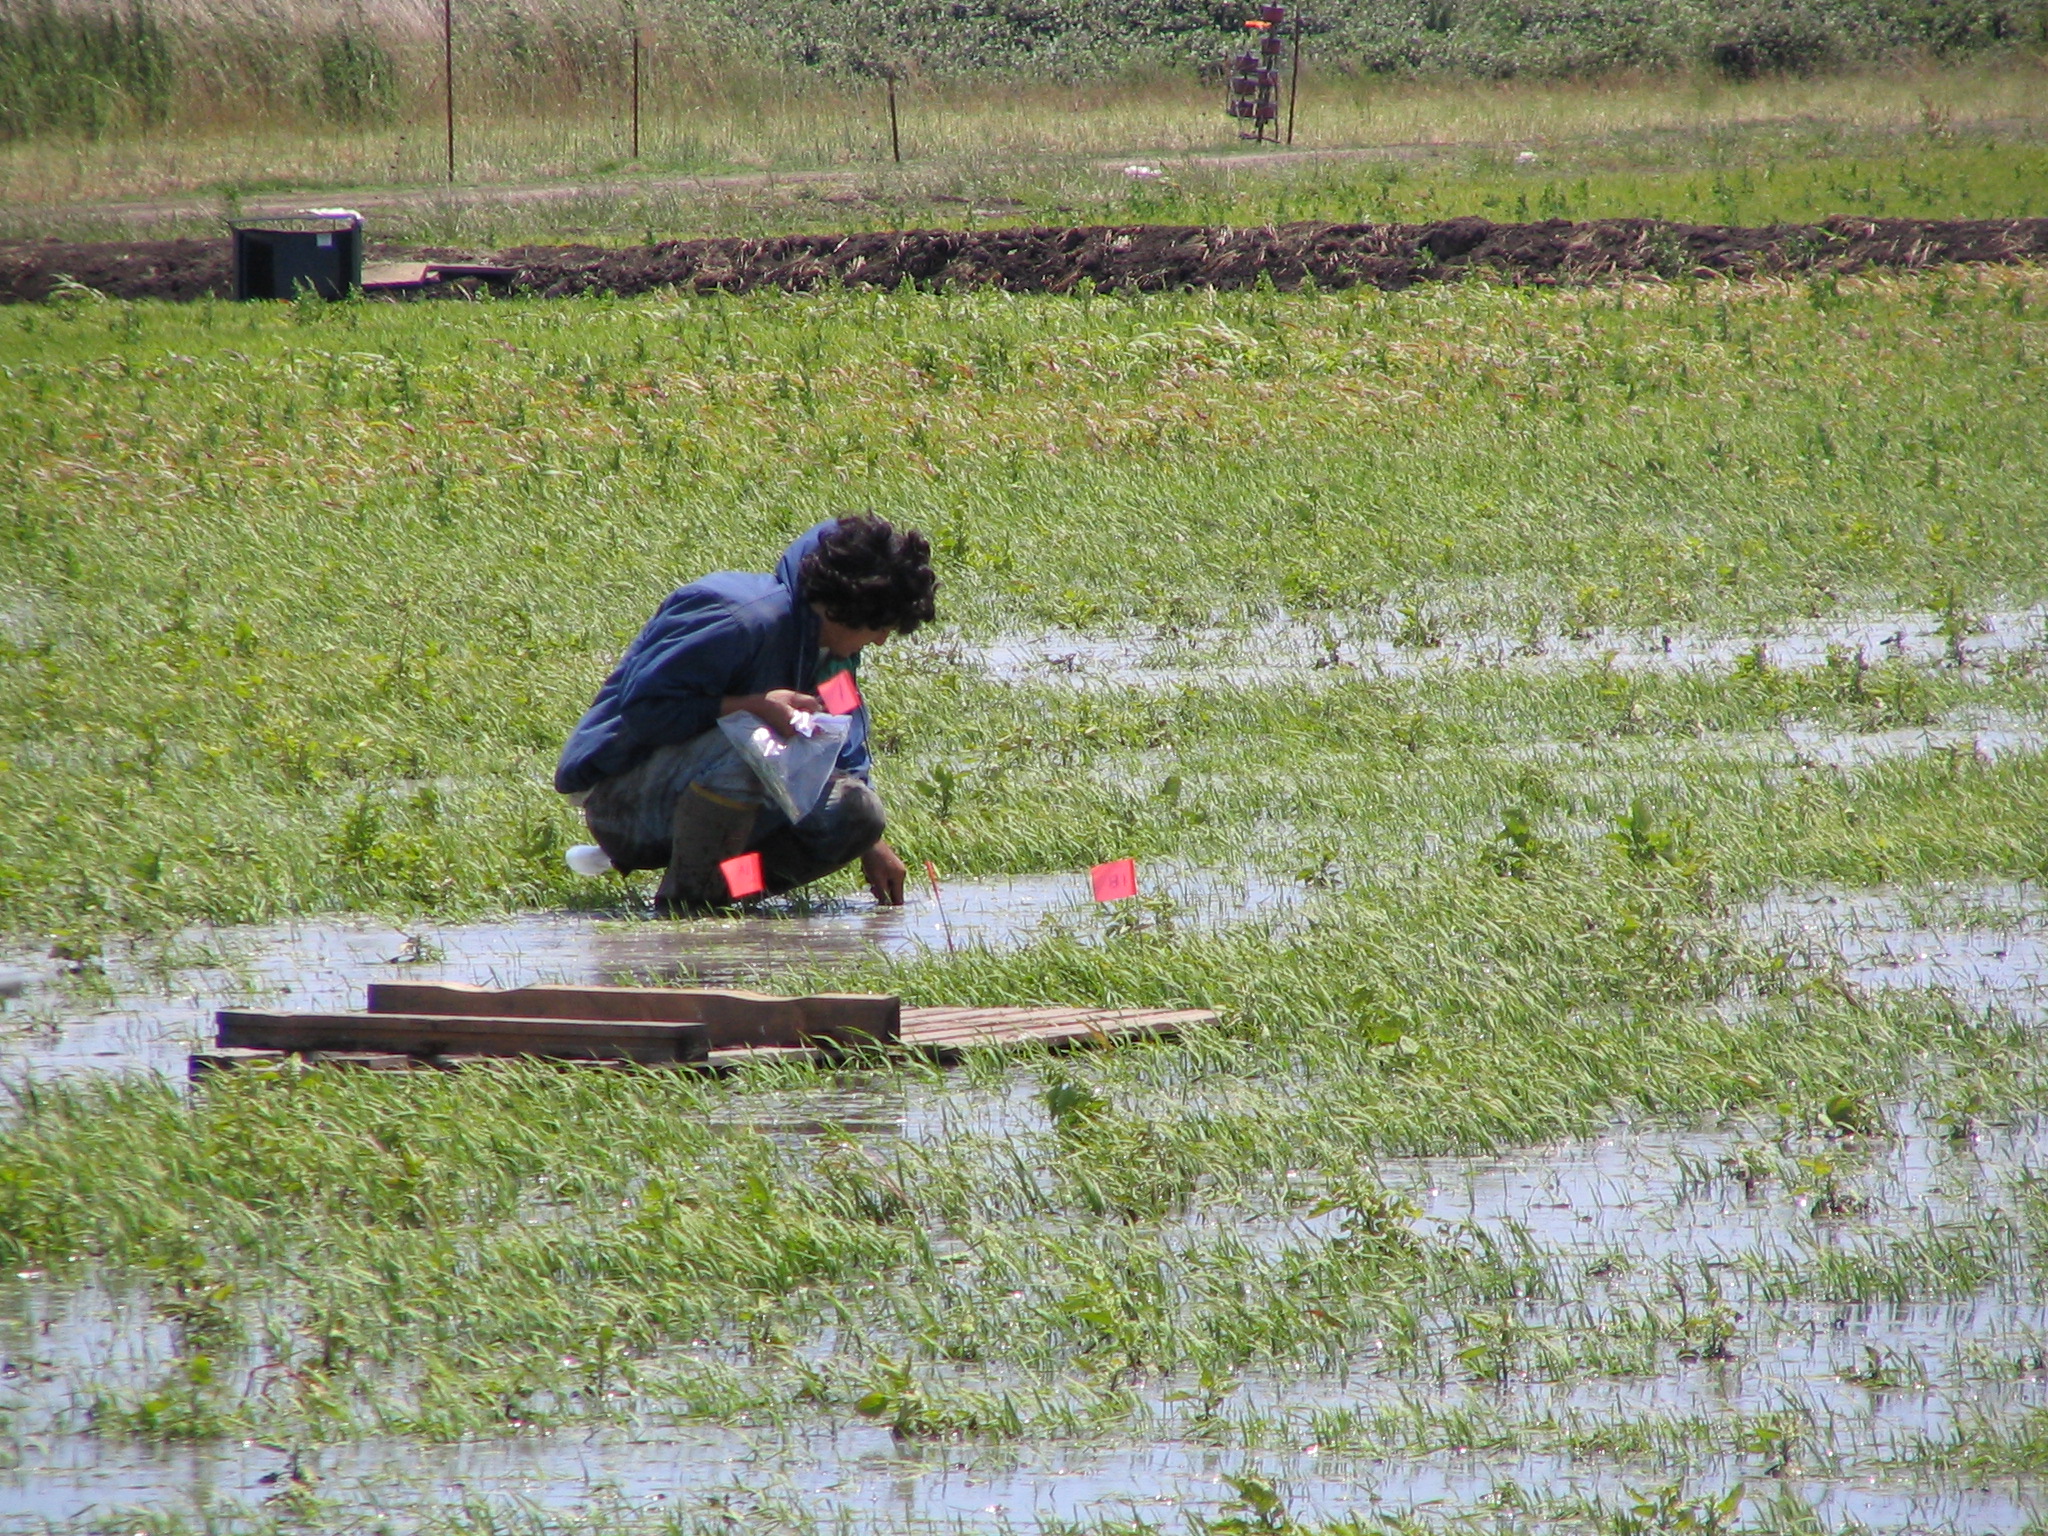
20090604TW_UCDInField.jpg ( 2009-06-04 13:05:29 ) Full size: 2048x1536
UC Davis student doing chamber measurements in the rice paddy
6 sets found
12 TW_met graphs found
No data found for TW_flux.
Can't check TWSI_mixed
Can't check SIMBTWEE_met
1 TW_cam graphs found
Can't check TATWBABCSB_cam