Field Notes

<--2010-09-08 07:50:00 | 2010-09-21 07:45:00-->
Other sites visited today: Twitchell Rice
Phenocam link: Searching...

Sherman Island: 2010-09-19 12:30:00 (DOY 262)
Author: Jaclyn Hatala
Others: Melanie

Summary: Standard field work

Sherman: Arrived around 12:30pm. Sky turning partly cloudy, but still some dark clouds. Took clip plot measurements - LAI is at 1.51, and is dominated by non-pepperweed low herbaceous plants. Water table is at about 58cm, but the far canals were wet, so maybe they are letting more water on the field now. Soil moisture was the same as the rest of the summer. Forgot to take screen shots, but LGR ring time was 15.79 and pressure 132.58.

2 photos found

Pepper weed and eddy tower at Sherman pasture
SI_091910_1.JPG ( 2010-09-19 12:43:57 ) Full size: 2048x1536
Pepper weed and eddy tower at Sherman pasture
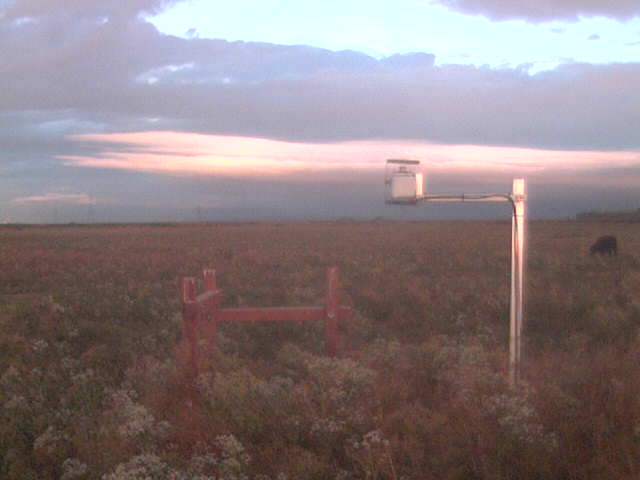
Nice clouds at dawn.
SI_webcam_20102620615.jpg ( 2010-09-19 06:15:02 ) Full size: 640x480
Nice clouds at dawn.

Graphs display:
7 sets found

1 SI_mp graphs found

Explore the graph:Moisture Point in a new window

11 SI_met graphs found

Explore the graph:Solar Radiation in a new window

Explore the graph:Energy in a new window

Explore the graph:Soil Temperatures Set 1 in a new window

Explore the graph:Soil Temperatures Set 2 in a new window

Explore the graph:Soil Temperatures Set 3 in a new window

Explore the graph:Soil Temperature at -16cm in a new window

Explore the graph:LED NDVI Sensor Output in a new window

Explore the graph:Solar Radiation from CNR1 in a new window

Explore the graph:Sherman Island Rain in a new window

Explore the graph:Sherman Well Level in a new window

Explore the graph:Box Temperatures in a new window

Can't check SI_mixed
2 SI_mixed graphs found

Explore the graph:Theta Probes in a new window

Explore the graph:Sherman Island Air Temperatures in a new window

5 SI_flx graphs found

Explore the graph:Sonic Wind in a new window

Explore the graph:CH4 Concentrations in a new window

Explore the graph:LI7700 Channels in a new window

Explore the graph:Sample Counts in a new window

Explore the graph:LI7500 CO2 and H2O in a new window

2 SI_soilco2 graphs found

Explore the graph:Sherman Island Vaisala Soil CO2 in a new window

Explore the graph:Soil CO2 Temperatures in a new window

Can't check TWSI_mixed
Can't check SIMBTWEE_met