Field Notes

<--2015-11-11 10:15:00 | 2015-12-11 10:50:00-->
Other sites visited today: Twitchell Rice | East End | West Pond | Twitchell Alfalfa
Phenocam link: Searching...

Mayberry: 2015-11-25 11:32:00 (DOY 329)
Author: Patty Oikawa
Others: Sara Knox

Summary: Serviced DO probes, regular site visit

Sara and I arrived at 11:16 am. The site is very brown now, skies were sunny with a little breeze. Sara serviced the DO probes. One needs new copper mesh—bring next time. There were quite a few ants on the tower and boards, bring ant trap next time. I downloaded data and cleaned sensors. The radiation boom was difficult to unscrew—remind Kyle not to screw so tightly.

Readings
7700
CH4: 1.92 ppm. 1.92 ppm after cleaning.
RSSI: 54.0%. 72% after cleaning.

7500
CO2: 412.67 ppm
H2O: 334.7 mmol m-3
SS: 98.65%--100.72 after cleaning
T: 15.34 C
P: 101.37 kPa
SOS: 338.9 m s-1

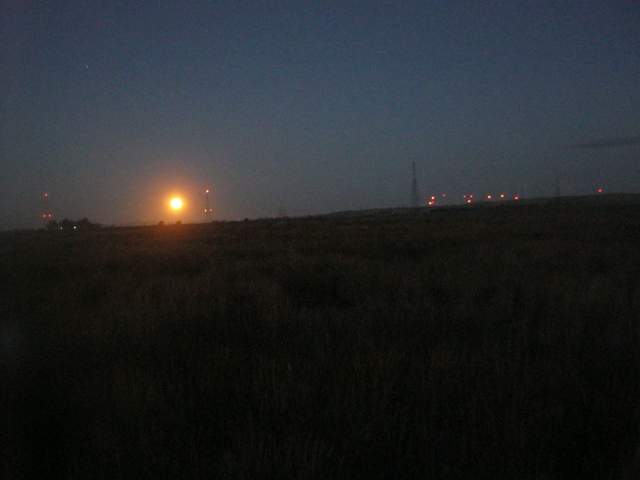
1 photos found

Dawn moon
MB_autocam_20151125_0615.jpg ( 2015-11-25 06:15:05 ) Full size: 1920x1440
Dawn moon

Graphs display:
11 sets found

7 MB_flux graphs found

Explore the graph:Sonic Wind in a new window

Explore the graph:LI7700 mV signals in a new window

Explore the graph:Counts in a new window

Explore the graph:LI7700 CH4 from analog signal in a new window

Explore the graph:LI7500 CO2 and H2O in a new window

Explore the graph:LI7700 CH4 from digital signal in a new window

Explore the graph:CO2 in ppm in a new window

No data found for MB_met.
27 MB_tule graphs found

Explore the graph:MB Tule Tower: Open Water 2 (3/1/11-3/23/17) in a new window

Explore the graph:MB Tule Tower: Open Water 1 (3/1/11-2/21/13) in a new window

Explore the graph:MB Tule Tower: Tule Temps 2 & 3 (3/1/11-3/19/14) in a new window

Explore the graph:MB Tule Tower: Tule Temps 1 (3/1/11-3/19/14) in a new window

Explore the graph:Mayberry Tule Tower: Solar Radiation in a new window

Explore the graph:Mayberry Tule Tower: Disolved Oxygen in a new window

Explore the graph:Mayberry Tule Tower: IRT and Sensor Temp in a new window

Explore the graph:Mayberry Tule Tower: Volts and RH in a new window

Explore the graph:LED NDVI Sensor in a new window

Explore the graph:Water CO2 in a new window

Explore the graph:Water Pressure in a new window

Explore the graph:Fluorometer Data in a new window

Explore the graph:Mayberry pCO2 Profile in a new window

Explore the graph:Water Temperatures in a new window

Explore the graph:Air Temperatures in a new window

Explore the graph:Air Pressure in a new window

Explore the graph:4-Way Radiometer in a new window

Explore the graph:MB Tule Tower: Open Water 1 (2/21/13-3/19/14) in a new window

Explore the graph:MB Tule Tower: Tule Temps 1 (3/19/14-now) in a new window

Explore the graph:MB Tule Tower: Open Water 1 (3/19/14-now) in a new window

Explore the graph:MB Tule Tower: Tule Temps 2 & 3 (3/19/14-3/23/17) in a new window

Explore the graph:MB Tule Tower: Tule Temps 2 (3/23/17-now) in a new window

Explore the graph:MB Tule Tower: Tule Temps 3 (3/23/17-now) in a new window

Explore the graph:SRS NDVI Channels in a new window

Explore the graph:SRS NDVI in a new window

Explore the graph:Net Radiation in a new window

Explore the graph:Conductivity in a new window

Can't check MBWPEESWGT_mixed
1 MB_cam graphs found

Explore the graph:Mayberry Autocam GCC in a new window

Can't check MBEEWPSWEPGT_cam
Can't check SIMBTWEE_met
1 MB_minidot graphs found

Explore the graph:Mayberry miniDot Dissolved Oxygen in a new window

Can't check MBSWEEWPBCBA
1 MB_processed graphs found

Explore the graph:Mayberry processed CO2 Fluxes in a new window

Can't check MB_fd
1 MB_fd graphs found

Explore the graph:Water Forced Diffusion CO2 Flux in a new window