Field Notes

<--2007-11-28 01:20:00 | 2007-12-18 12:00:00-->
Phenocam link: Searching...

Sherman Island: 2007-12-07 09:00:00 (DOY 341)
Author: Matteo Detto
Others:

Summary: Took soil moisture and downloaded data for Sherman Island.

Sherman Island - Methane Study

Date 7 December 2007

Day 341

Standard Time in: Out:

Who: MD

Weather: clear sky, windy

Phenology: dry weed

Tasks

  1. check and download data at Sherman Island
  2. take soil moisture

Check list

  1. Fence and gate power: OK
  2. Datalogger Solar Panel and Batteries: 12.10
  3. Reading from Gillsonic (H2O and CO2 should be in the range of 0 – 5 v.)

Time

Path/File

D:\Data\SI07 .raw

mean

std

mean

std

w

-0.9

Ts

14.1

u

1.6

H2O

2.1

v

5.9

CO2

2.0

CH4

1.86

  1. Methane Sensor (type Scroll Scroll 2)

Methane Hi-flow ppm

1.861

Cell Pressure – near 159

104 / 135 after replacing 2micron filter

Cell Temperature

23.20

Mirror time

16.2

Sample rate

10 Hz

Methane low flow put back in high flow !

Pump status

Filter Status

Water traps

  1. If Swapping Li-7500 Analyzer. (Remove SN# ; install SN# )
  2. Check the fans of air temp. and relative humidity sensors
  3. Check MD-9 system connections
  4. Check CR23X with two multiplexers and sensor values
  5. Check levels of Radiation sensors, clear up surfaces.

Closed gate and set up fence.

Other Notes:

Remember next time to:

1 photos found

Nice clouds
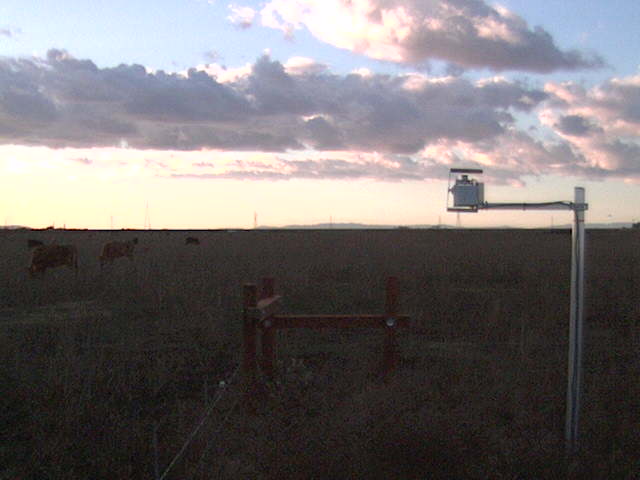
SI_webcam_2007341_1606.jpg ( 2007-12-07 16:06:04 ) Full size: 640x480
Nice clouds

Graphs display:
7 sets found

No data found for SI_mp.
10 SI_met graphs found

Explore the graph:Solar Radiation in a new window

Explore the graph:Energy in a new window

Explore the graph:Soil Temperatures Set 1 in a new window

Explore the graph:Soil Temperatures Set 2 in a new window

Explore the graph:Soil Temperatures Set 3 in a new window

Explore the graph:Soil Temperature at -16cm in a new window

Explore the graph:Solar Radiation from CNR1 in a new window

Explore the graph:Sherman Island Rain in a new window

Explore the graph:Sherman Well Level in a new window

Explore the graph:Box Temperatures in a new window

Can't check SI_mixed
2 SI_mixed graphs found

Explore the graph:Theta Probes in a new window

Explore the graph:Sherman Island Air Temperatures in a new window

4 SI_flx graphs found

Explore the graph:Sonic Wind in a new window

Explore the graph:CH4 Concentrations in a new window

Explore the graph:Sample Counts in a new window

Explore the graph:LI7500 CO2 and H2O in a new window

No data found for SI_soilco2.
Can't check TWSI_mixed
Can't check SIMBTWEE_met