Field Notes
<--2015-06-25 09:15:00 | 2015-07-01 09:30:00-->Phenocam link: Searching...
Twitchell Alfalfa: 2015-06-29 09:00:00 (DOY 180)
Author: Joe Verfaillie
Others: Dennis, Miguel, Aaron, Yi-wen
Summary: Set up of the LGR trailer with CO2 isotope analyzer, soil chamber measurements.
| Alfalfa 2015-06-29 I arrived about 9am with Dennis and Miguel and we met Aaron and Yi-wen from LGR. It was clear and sunny and warm with a nice breeze from the west. The roads to the Alfalfa site were dry and the ditch to the north of the field was almost dry too. The edge of the field to the south has been mowed. The task for the day is to set up the LGR trailer with a CO2 isotope analyzer. Aaron was able to back the LGR trailer down the ditch to just north of the tower. They ran 25ft of tubing (1/4†OD, 3/16†ID) tubing from the top of the tower to an inlet with funnel tied to the bottom of the sonic path (11†below center of sonic path). Aaron and I got a diesel generator left by Jim and Bruce and parked it about 50ft south of the tower. We tried to plug the generator into the trailer power system but kept popping the GFI on the generator. We grounded the generator and swapped out the GFI, but it still would not work with the trailer power system. We ended up just running the generator to a power strip. Later we notice that the generator was only supplying about 100 to 105VAC. This might have been confusing the trailer charge controller. We set up a laptop with TeamViewer for a remote connection and connected to the internet through the ATT Unite hot spot. Miguel did soil respiration measurements on the existing six soil collars every 30min while we were there. The 7500 read: 395ppm CO2, 594mmol/m3 H2O, 83.8SS, 31.47C, 100.92kPa The LGR instrument is the new CCIA-48. The precision spec is: Model CCIA-48 (1σ, 1 sec / 2 minutes): δ13C: 0.7‰ / 0.08‰ δ18O: 0.7‰ / 0.08‰ δ17O: 1.8‰ / 0.18‰ [ 12CO2 ]: 200 ppb / 20 ppb [ 13CO2 ]: 2 ppb / 0.2 ppb [CO18O]: 0.4 ppb / 0.04 ppb [CO17O]: 0.3 ppb / 0.03 ppb The website of the instrument is here: http://www.lgrinc.com/documents/LGR_CCIA-48_Datasheet.pdf The laser is at 4.3 micron, and the operational range is 100-2500 ppm. It's sensitive to temperature, but our particular box doesn't show a strong temperature sensitivity. Of course it also hasn't been exposed to the "real world" prior to the deployment. We should find out more about this. The reference gas measurement should really help though. We operate at 40 Torr and around 46.2 C. |
2 photos found

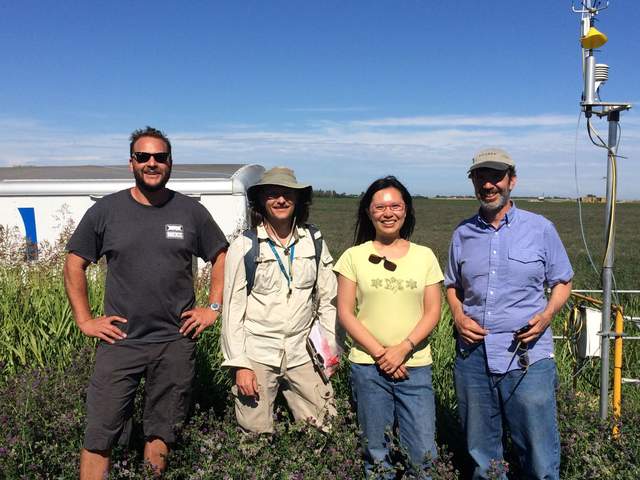
20150629TA_AaronJoeYiwenDennis.jpg ( 2015-06-29 13:30:00 ) Full size: 1920x1440
Arron, Joe, Yiwen and Dennis at Alfalfa installing isotope system

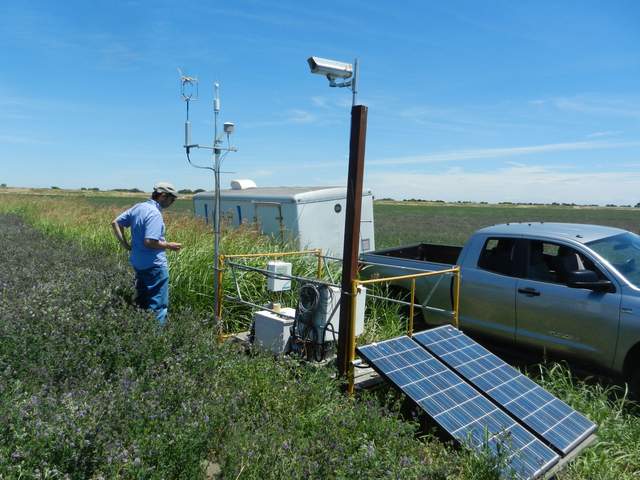
20150629TA_LGRatAlfalfa.jpg ( 2015-06-29 12:31:30 ) Full size: 1920x1440
Dennis over seeing of setup of the LGR Isotope analyzer in the alfalfa field
7 sets found
Can't check TA_met
11 TA_met graphs found
Can't check TA_rad
3 TA_rad graphs found
Can't check TA_flux
5 TA_flux graphs found
Can't check TA_soilco2
7 TA_soilco2 graphs found
No data found for TA_arable.
1 TA_cam graphs found
Can't check TATWBABCSB_cam

