
Field Notes
<--2015-06-18 13:00:00 | 2015-06-29 09:00:00-->Other sites visited today: Mayberry | Twitchell Rice | East End | West Pond
Phenocam link: Searching...
Twitchell Alfalfa: 2015-06-25 09:15:00 (DOY 176)
Author: Cove Sturtevant
Others: Joe, Sara
Summary: Data download. Regular field work. Added theta probes to 12V power supply. Three thermocouples out in the soil CO2 system. Updated autocam to autorestart.
| Twitchell Alfalfa 2015-06-25 We arrived at about 09:15 PDT. Sunny and warming quickly. Light breeze. The alfalfa is already flowering. We noted a helicopter spraying herbicide over the rice fields to the west. Downloaded data. Sara did veg height, spectral, and soil respiration. Joe added the theta probes to the new 12V power supply. I reset the MET CR1000 station clock. It was 2 min ahead. Cleaned radiation sensors. A few readings out in the soil CO2 system: TCB16 reading NaN. Tested channel with spare thermocouple – it read fine so the tc is the problem. TCFD soil and air reading NaN. Joe informed us that to run the soil CO2 sensors we can change the ‘testflag’ field in the loggernet data table to 1. Joe updated the autocam firmware and set the script to start on power up. 7500 readings: CO2 = 302 ppm (399 after cleaning) H2O = 1280 mmol m-3 (700 after cleaning) signal strength = 68.7% (83.65% after cleaning) p = 101.1 kPa t = 26.6 C sos = 349.5 m s-1 |
Veg Height (cm): Tape measure from ground to top of plant
53, 47, 44, 61, 41, 37, 55, 31, 52, 61, 81, 56, 46, 56, 47, 49, 58, 50, 47, 48, avg = 51, stdev = 10.39
1 photos found
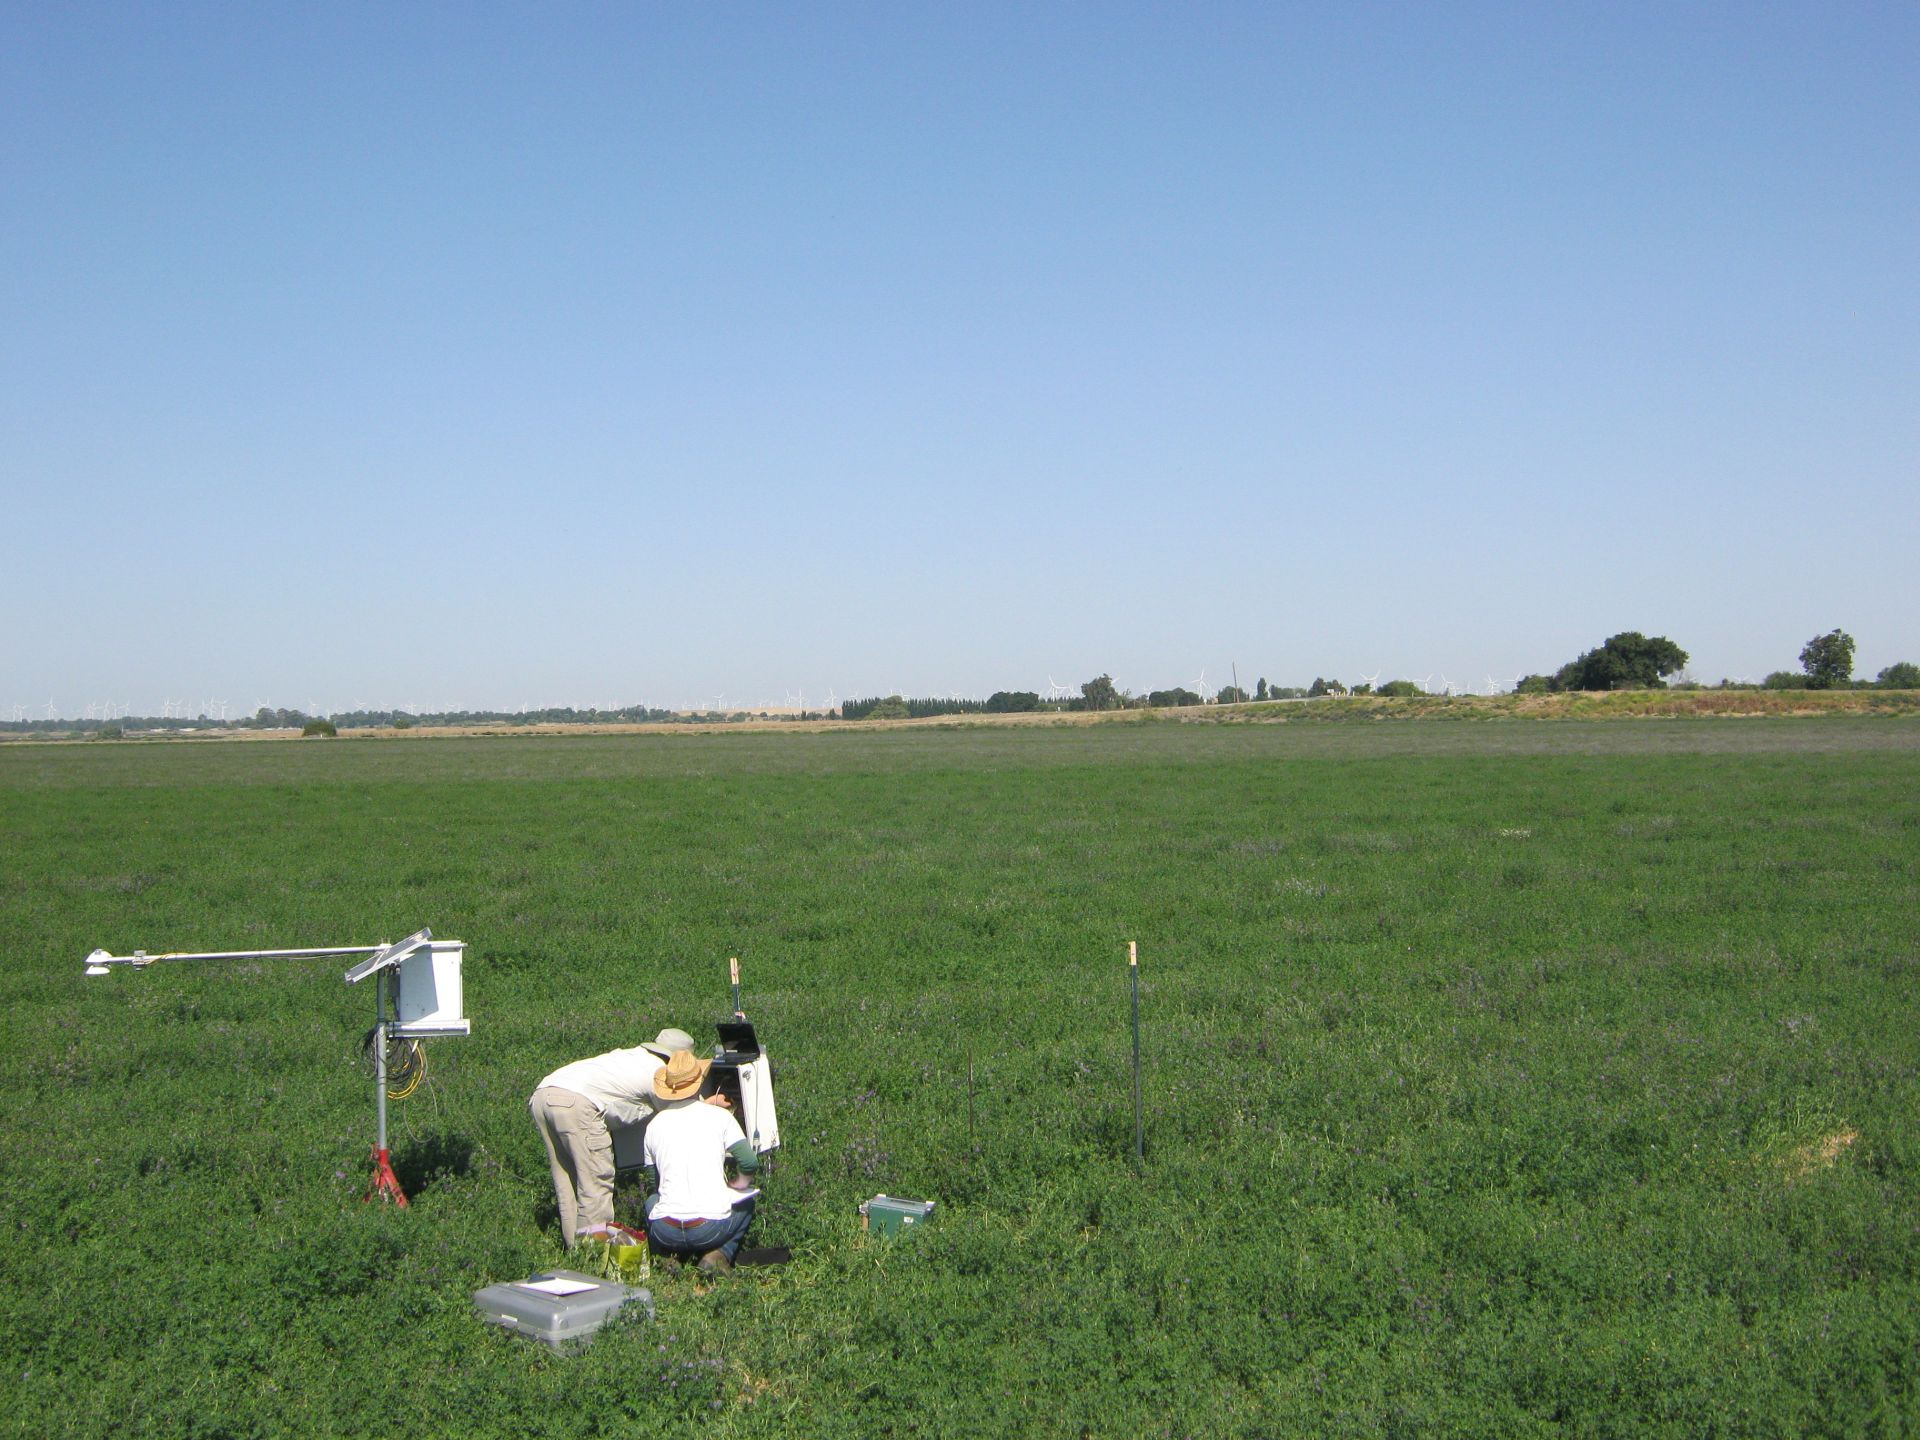
TA_autocam_20150625_0845.jpg ( 2015-06-25 08:45:00 ) Full size: 1920x1440
Joe and Cove on site
7 sets found
Can't check TA_met
11 TA_met graphs found
Can't check TA_rad
3 TA_rad graphs found
Can't check TA_flux
5 TA_flux graphs found
Can't check TA_soilco2
7 TA_soilco2 graphs found
No data found for TA_arable.
1 TA_cam graphs found
Can't check TATWBABCSB_cam