Field Notes
<--2015-05-21 11:15:00 | 2015-06-09 11:50:00-->Other sites visited today: Twitchell Alfalfa
Phenocam link: Searching...
East End: 2015-05-28 10:00:00 (DOY 148)
Author: Joe Verfaillie
Others: Cove, Stephen, Alex
Summary: Calibrated 7700, Ameriflux inter-comparison starting, raised solar panels a bit.
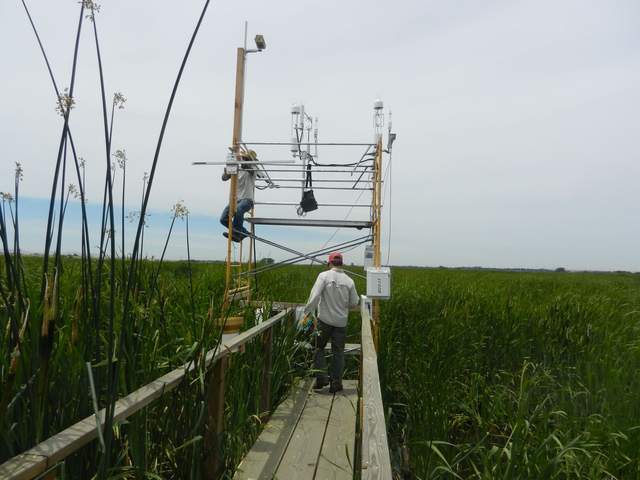
| East End 2015-05-28 I arrived about 10:00am with Cove and Stephen and Alex from Ameriflux. It was mild and hazy with a nice breeze. The tules and cattails are flowering and the tips of the cattails are slightly brown. An Ameriflux inter-comparison starts today. Cove and I add some rails and a post to the top of the scaffolding with speed rail fittings for the Ameriflux equipment installation. Ameriflux set up six solar panels on the slope of the levee near the start of the boardwalk. I worked on raising the solar panels about 18in. The panels are now at about the same level as the tops of the cattails instead of being below them. I also washed the panels. Cove calibrated the LI-7700 sn TG1-0155. The zero was off by 26ppb, but the span was right on. We helped mount Ameriflux stuff for a while and then left Stephen and Alex to finish it up. |
3 photos found

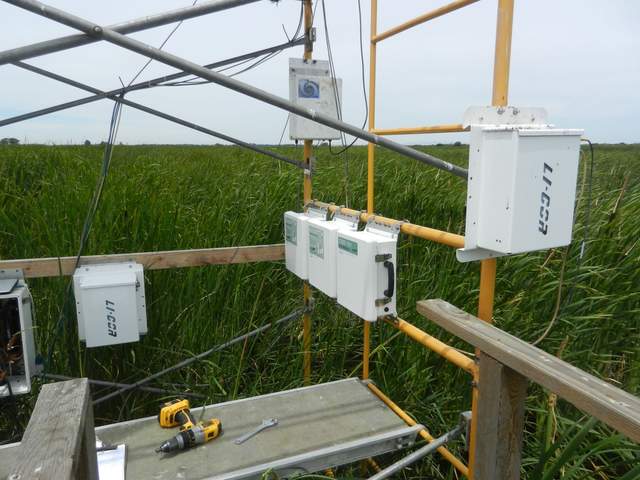
20150528EE_LicorEverywhere.jpg ( 2015-05-28 12:32:18 ) Full size: 1920x1440
Licor boxes everywhere all at once

20150528EE_AmerifluxIntercompare.jpg ( 2015-05-28 12:58:59 ) Full size: 1920x1440
Ameriflux intercomparison

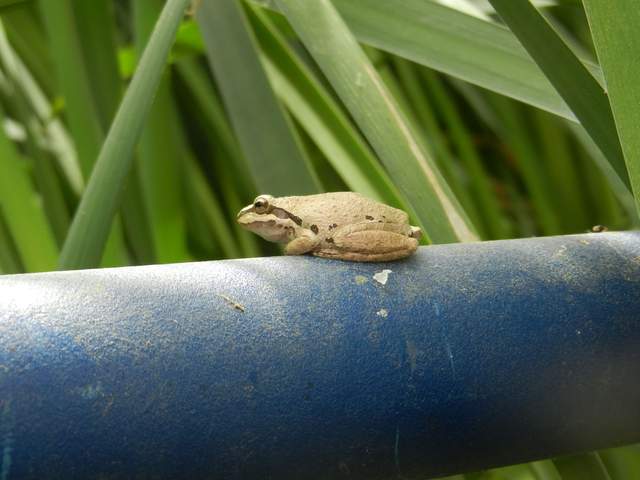
20150528EE_Frog.jpg ( 2015-05-28 11:02:19 ) Full size: 1920x1440
Tree frog
11 sets found
14 EE_met graphs found
Can't check EE_mixed
1 EE_mixed graphs found
8 EE_flux graphs found
Can't check MBWPEESWGT_mixed
1 EE_cam graphs found
Can't check MBEEWPSWEPGT_cam
Can't check SIMBTWEE_met
Can't check EE_Temp
5 EE_Temp graphs found
Can't check EE_minidot
1 EE_minidot graphs found
Can't check MBSWEEWPBCBA
1 EE_processed graphs found

