Field Notes

<--2015-03-05 12:00:00 | 2015-04-09 11:50:00-->
Other sites visited today: Sherman Island | Mayberry | Twitchell Rice | West Pond | Twitchell Alfalfa
Phenocam link: Searching...

East End: 2015-03-24 11:20:00 (DOY 83)
Author: Cove Sturtevant
Others: Dennis, Joe, Housen

Summary: Water level higher. Data download. Raspberry pi working well.

East End Wetland
2015-03-24

We arrived around 11:20 PDT. It windy, cool, and partly cloudy. Water level was a bit higher. Downloaded data. Raspberry pi camera was working well.

Readings:
CO2 = 16.6 mmol m-3 (16.9 after cleaning)
H2O = 620 mmol m-3 (580 after cleaning)
p = 102.7 kPa
t = 20 C
diag: 247
sos: 343 m s-1
CH4: 1.96 ppm (same after cleaning)
RSSI: 33% (73% after cleaning)

1 photos found

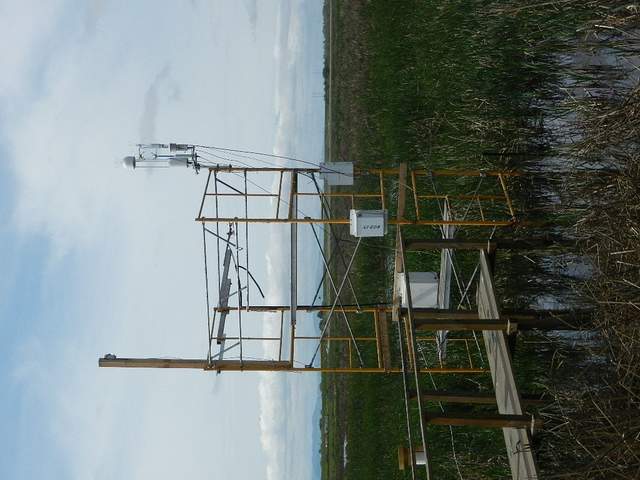
East End tower
20150324EE_Tower.jpg ( 2015-03-24 12:55:40 ) Full size: 1024x768
East End tower

Graphs display:
11 sets found

14 EE_met graphs found

Explore the graph:Temperature and Batt V in a new window

Explore the graph:Soil Moisture and Well Pressure in a new window

Explore the graph:Solar Radiation in a new window

Explore the graph:PAR in a new window

Explore the graph:Soil Heat Flux in a new window

Explore the graph:Water Level and Rain in a new window

Explore the graph:Soil/Water Temperature Set 1 in a new window

Explore the graph:Soil/Water Temperature Set 2 in a new window

Explore the graph:Soil/Water Temperature Set 3 in a new window

Explore the graph:Dissolved Oxygen and Wind Speed in a new window

Explore the graph:SRS NDVI Channels in a new window

Explore the graph:Apogee NDVI in a new window

Explore the graph:NDVI in a new window

Explore the graph:Undercanopy PAR in a new window

Can't check EE_mixed
1 EE_mixed graphs found

Explore the graph:Air Pressure and RH in a new window

8 EE_flux graphs found

Explore the graph:Wind Speeds in a new window

Explore the graph:LI7500 CO2 and H2O in a new window

Explore the graph:LI7700 CH4 and RSSI in a new window

Explore the graph:Flux Counts in a new window

Explore the graph:Instument Temperatures in a new window

Explore the graph:Temp Tower 3 (Mixed Veg) in a new window

Explore the graph:Temp Tower 3 (Mixed Veg) in a new window

Explore the graph:Temp Tower 3 (Mixed Veg) in a new window

Can't check MBWPEESWGT_mixed
1 EE_cam graphs found

Explore the graph:EE Autocam GCC in a new window

Can't check MBEEWPSWEPGT_cam
Can't check SIMBTWEE_met
Can't check EE_Temp
5 EE_Temp graphs found

Explore the graph:Sonic SOS in a new window

Explore the graph:LI7500 CO2 in a new window

Explore the graph:Water Level in a new window

Explore the graph:LI-7700 CH4 in a new window

Explore the graph:Wind Speed in a new window

Can't check EE_minidot
1 EE_minidot graphs found

Explore the graph:EE miniDOT Dissolved Oxygen in a new window

Can't check MBSWEEWPBCBA
1 EE_processed graphs found

Explore the graph:CO2 Fluxes in a new window