Field Notes
<--2010-08-05 09:30:00 |
2010-08-19 10:30:00-->
Phenocam link:
Searching...Tonzi: 2010-08-14 05:10:00 (DOY 226)
Author: Siyan Ma
Others:
When: Date: 8/14/2010 , Day: 226
, Watch Time: 5:10am .
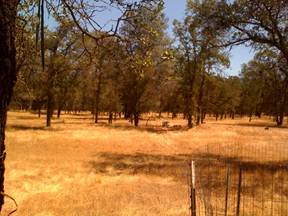
Where: Tonzi/Vaira Ranch
Who: Siyan
Weather: Sunny
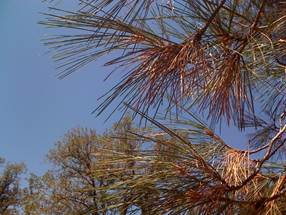
Phenology: yellow grass, green oak leaf
Summary
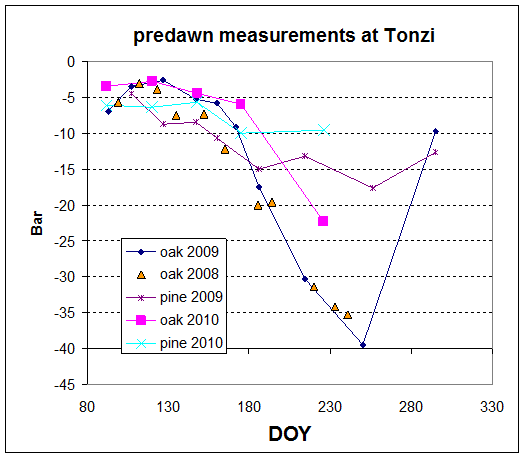
- Predawn water potential: oak = -10 ~ -30 bar; pine needles
= -3 ~ -24 bar
- swap Li-7500 at Tower, Floor, and Vaira,
- check and download data
- soil moisture
- dendrometer
- oak and pine samples at Tonzi
- ground water
location
|
Ft (no black thing)
|
floor
|
24.71
|
tower
|
29.25
|
roadside
|
34.11
|
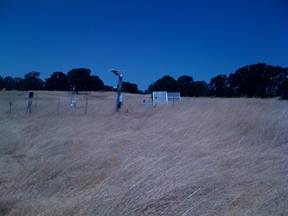
Vaira_Grass Site
- Fence and gate power: OK v.
- Panel and Batteries: - v; - amps;
- amps.
- Reading from Gillsonic screen before downloading data.
(The value of H2O and CO2 should be in the range of
0 � 5 v.)
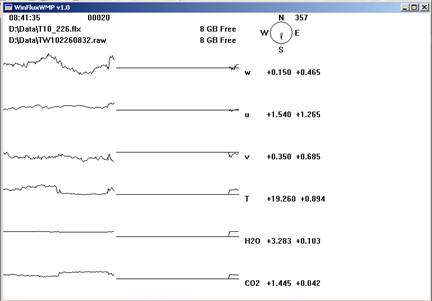
Time
|
OK
|
Path/File name
|
D:DataVR10_ .flx
D:DataVR10
.raw
|
|
mean
|
std
|
|
mean
|
std
|
w
|
0.35
|
1.483
|
Ts
|
28.06
|
0.039
|
u
|
1.61
|
0.763
|
H2O
|
3.21
|
0.038
|
v
|
1.54
|
1.695
|
CO2 |
1.518
|
0.018
|
- downloading data YES!
- swap Li-7500: remove sn 0976 install sn 0418
- check the fans of air temp. and relative humidity sensors
at Vaira. YES!
- Check MD-9 system connections YES!
- Check levels of Radiation sensors, clear up surfaces. YES!
- Closed gate and set up fence. YES!
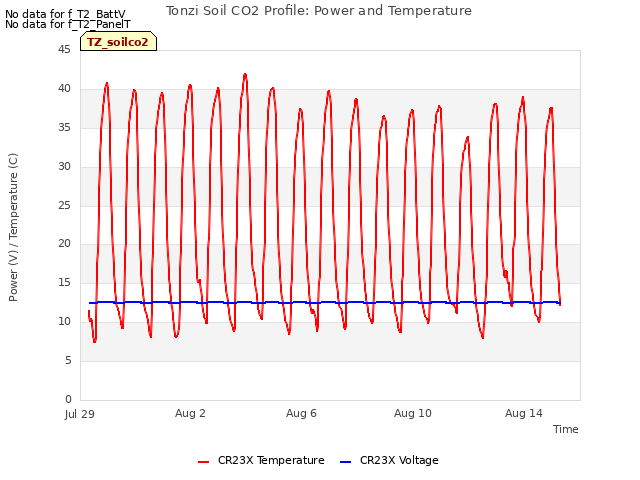
Tonzi_Tower Site
- Fence and gate power: OK v.
- Panel and Batteries: - v; - amps;
- amps.
- Reading from Gillsonic screen before downloading data.
(The value of H2O and CO2 should be in the range of
0 � 5 v.)
 - downloading data YES!
- swaping Li-7500 Analyzer. (Remove sn 0065 ;
install sn 0073 )
- check the fans of air temp. and relative humidity sensors
on the tower and the floor. YES!
- Check calibration cylinders;
CO2 2100 psig;
flow 20 psi.
N2 1600
psig; flow 20 psi.
Manually calibrate Li-800. Following Ted�s instruction:
H:IoneSavanna_2004Tower_2004CO2ProfileLI800_Calibration_Procedure_2Nov04.txt
YES! No screen copy because of PC.
- close gate and set up fence. YES!
Toniz_Floor Site
- Fence and gate power: 12 v.
- Panel and Batteries: 13.6 v; 18.7
amps; 1.8 amps.
- Reading from Gillsonic screen before downloading data.
(The value of H2O and CO2 should be in the range of
0 � 5 v.)
Time
|
|
Path/File name
|
D:DataF10_ 226 .flx
D:DataFL10
.raw
|
|
mean
|
std
|
|
mean
|
std
|
w
|
-0.31
|
0.254
|
Ts
|
16.8
|
0.294
|
u
|
-0.52
|
0.38
|
H2O
|
1.5
|
0.0511
|
v
|
0.49
|
0.298
|
CO2 |
2.1
|
0.009
|
- downloading data YES!
- swaping Li-7500 Analyzer. (Remove sn 0035 ;
install sn 0042 )
- Check MD-9 system connections YES!
CR23X3 � floor-Met
CR23X5 � soil CO2
profile
CR23X6 � tower-Met
CR10X2 � floor-Met
CR10X4 � sap-flow
CR10X7 � CO2 profile
CR10X8 � wind profile
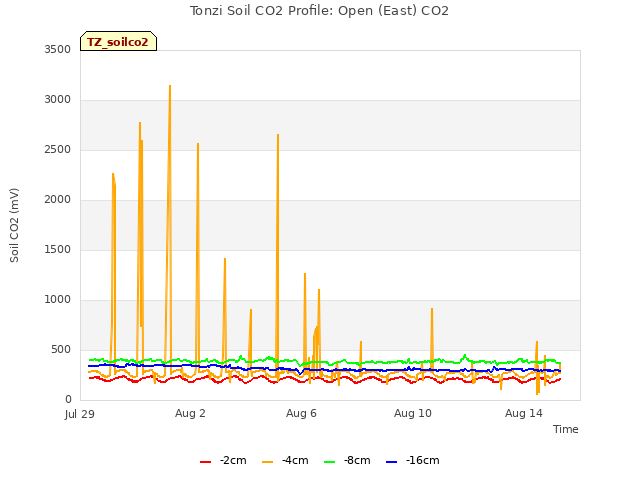
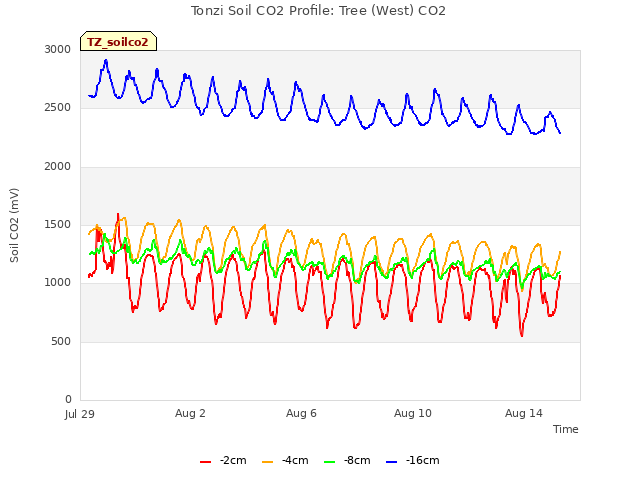
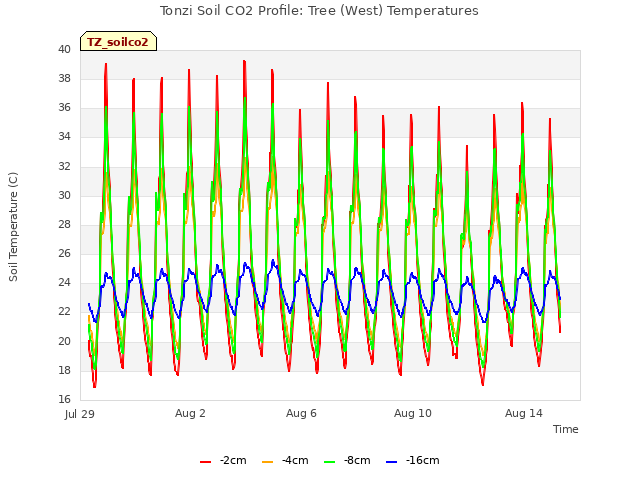
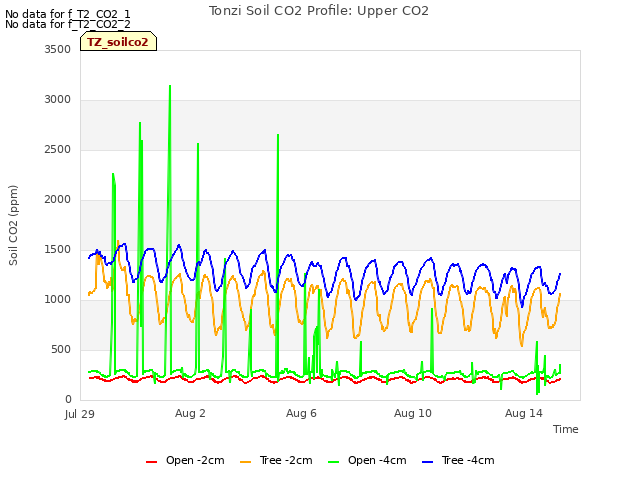
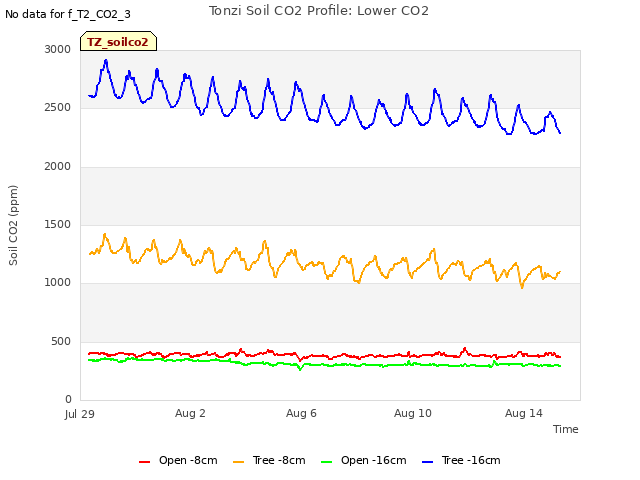
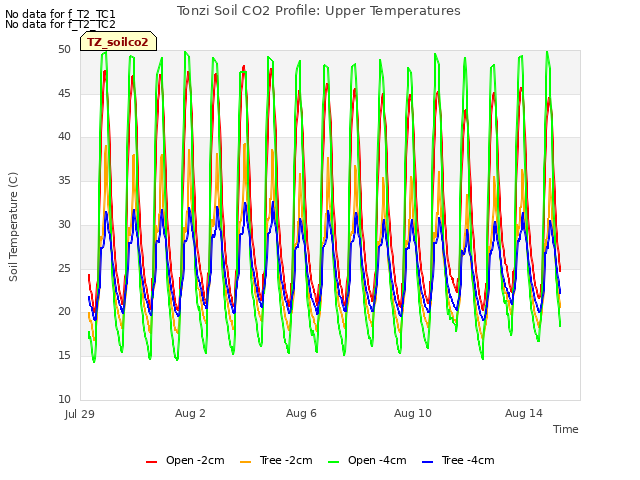
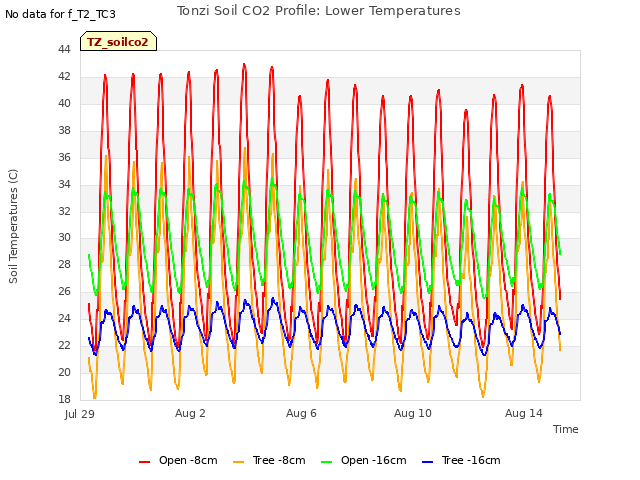
- Soil CO2 profile OK!
Reading from panels of analyzers
depth
|
Open
|
order
|
depth
|
Tree
|
order
|
2cm (1%)
|
2250
|
1
|
2cm (1%)
|
450
|
1
|
4cm
|
2680
|
2
|
4cm
|
570
|
4
|
8cm
|
2290
|
3
|
8cm
|
760
|
2
|
16cm
|
4670
|
4
|
16cm
|
610
|
3
|
- Close gate and set up fence.
tonzi
|
7931AFE
|
402165
|
574B4B
|
402FF3
|
574632
|
7A432E
|
7A3C6E
|
7A3B40
|
7A4AAA
|
8/14/2010
|
226
|
|
|
|
|
|
|
|
|
|
sm
|
|
|
|
|
|
|
|
|
0-15
|
7.6
|
3.0
|
9.6
|
3.0
|
6.7
|
7.1
|
7.6
|
2.6
|
4.1
|
15-30
|
13.5
|
9.1
|
12.6
|
12.9
|
7.8
|
8.9
|
11.1
|
13.5
|
5.1
|
30-45
|
17.3
|
9.0
|
12.9
|
15.6
|
6.3
|
10.8
|
18.3
|
15.2
|
13.4
|
45-60
|
15.9
|
8.1
|
17.3
|
13.5
|
22.2
|
12.2
|
11.1
|
23.9
|
10.3
|
|
|
|
|
|
|
|
|
|
|
|
A6D882B
|
A3D04E8
|
A6D72F5
|
|
|
|
|
|
|
|
|
|
|
|
|
|
|
|
|
0-15
|
5.9
|
0.9
|
1.2
|
|
|
|
|
|
|
15-30
|
7.5
|
1.7
|
17.8
|
|
|
|
|
|
|
30-45
|
16.1
|
15.1
|
13.3
|
|
|
|
|
|
|
45-60
|
17.8
|
22.4
|
41.4
|
|
|
|
|
|
|
|
|
|
|
|
|
|
|
|
|
vaira
|
57318a
|
7933dee
|
|
|
|
|
|
|
|
0-15
|
broken
|
0.9
|
|
|
|
|
|
|
|
15-30
|
broken
|
11.7
|
|
|
|
|
|
|
|
30-45
|
broken
|
16.5
|
|
|
|
|
|
|
|
45-60
|
broken
|
28.4
|
|
|
|
|
|
|
|
Tonzi
|
|
|
|
|
|
Dendrometer
|
|
|
|
|
|
|
|
|
|
|
Date
|
Day
|
Tag
#
|
Reading (mm)
|
|
|
8/14//2010
|
226
|
72
|
11.6
|
|
|
|
|
79
|
16.0
|
|
|
|
|
245
|
12.6
|
|
|
|
|
250
|
21.6
|
(reset to 10.5 on May 7, 2009)
|
|
|
|
1
|
21.1
|
|
|
|
|
2
|
10.5
|
|
|
|
|
3
|
17.9
|
|
|
|
|
4
|
8.9
|
|
|
|
|
5
|
8.6
|
|
|
|
|
7
|
15.9
|
|
|
|
|
8
|
17.0
|
11828
|
|
|
|
102
|
X
|
|
|
|
|
71
|
X
|
|
|
|
|
77
|
X
|
‌
|
|
|
|
78
|
X
|
‌
|
|
|
|
248
|
X
|
broken
|
|
|
|
255
|
X
|
‌
|
|
|
|
‌252‌
|
X
|
‌
|
|
|
|
6
|
X
|
|
|
 /> /> |
Field Data
No tank data
Well Depth
| Date | Location | Depth (feet) |
|---|
| 2010-08-14 | TZ_floor | 24.71 |
| 2010-08-14 | TZ_road | 34.11 |
| 2010-08-14 | TZ_tower | 29.25 |
No TZ Moisture Point data found
No VR Moisture Point data found
No TZ grass heigth found
No VR grass heigth found
No TZ Tree DBH found
Water Potential - mode: raw
| Time | Species | Tree | readings (bar) |
|---|
| 2010-08-14 04:43:00 |
OAK |
UNKNOWN |
-30.5 |
-26 |
-29 |
-10.6 |
-11.5 |
-11 |
-26.5 |
-26 |
-30 |
| 2010-08-14 04:43:00 |
PINE |
UNKNOWN |
-7 |
-3 |
-5.1 |
-6 |
-3 |
-24.5 |
-6 |
-22.5 |
|
| 2010-08-14 12:05:00 |
OAK |
UNKNOWN |
-50.1 |
-43 |
-51.5 |
-35 |
-37 |
-52 |
-40 |
|
|
| 2010-08-14 12:05:00 |
PINE |
UNKNOWN |
-4.5 |
-3.5 |
-2.5 |
-20 |
-20 |
|
|
|
|
No TZ Grass Biomass data found
No TZ OakLeaves Biomass data found
No TZ PineNeedles Biomass data found
0 photos found
16 sets found
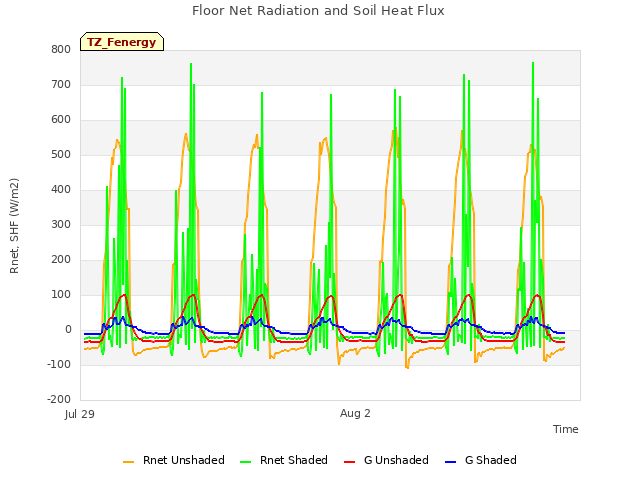
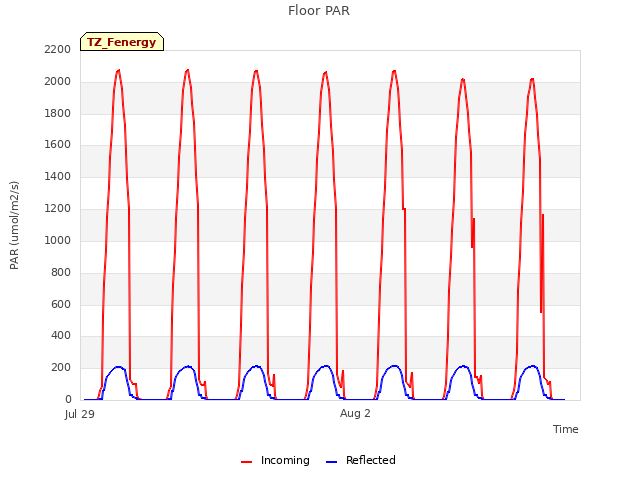
3 TZ_Fenergy graphs found
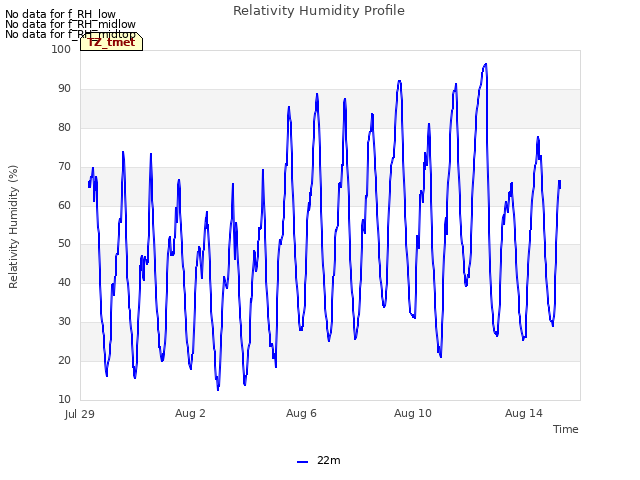
11 TZ_tmet graphs found


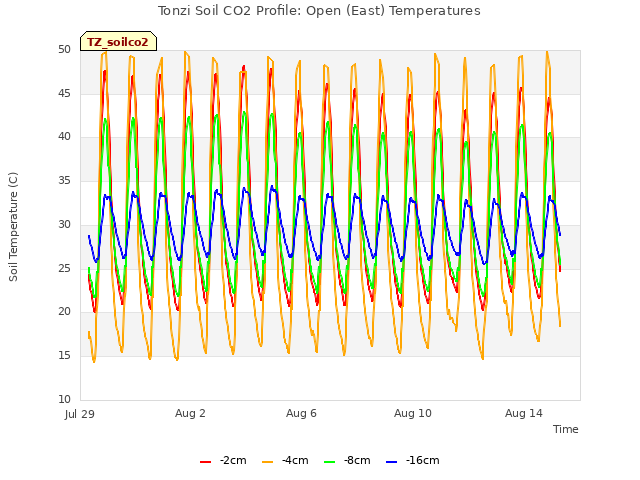
11 TZ_soilco2 graphs found


Can't check TZ_mixed
3 TZ_mixed graphs found

1 TZ_fflux graphs found

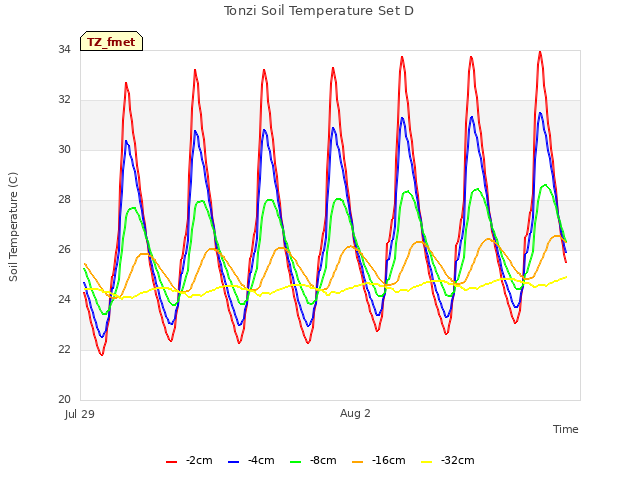
8 TZ_fmet graphs found


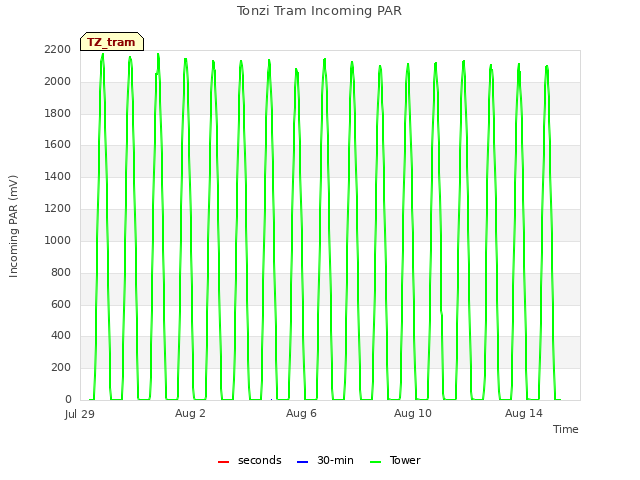
1 TZ_tram graphs found
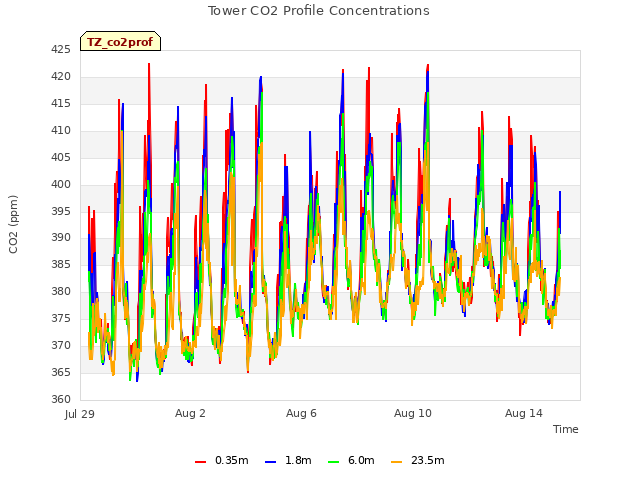
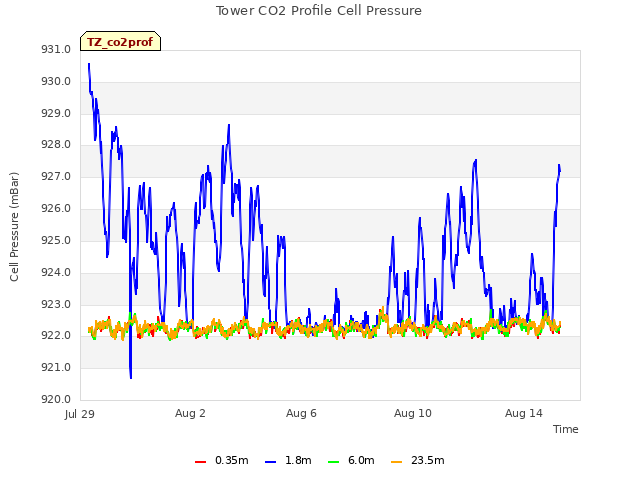
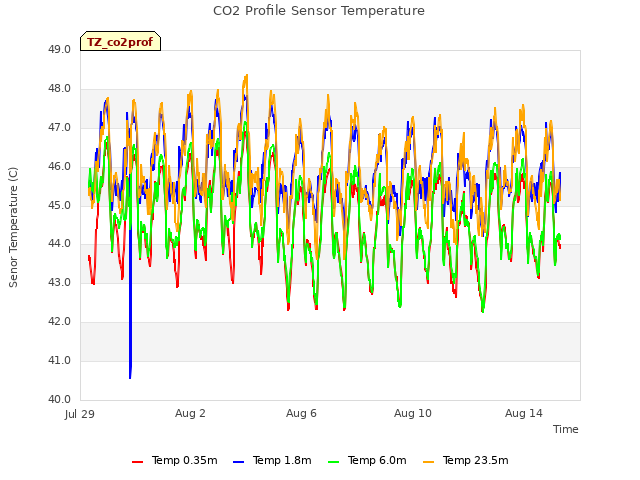
3 TZ_co2prof graphs found
No data found for TZ_irt.
No data found for TZ_windprof.
1 TZ_tflux graphs found

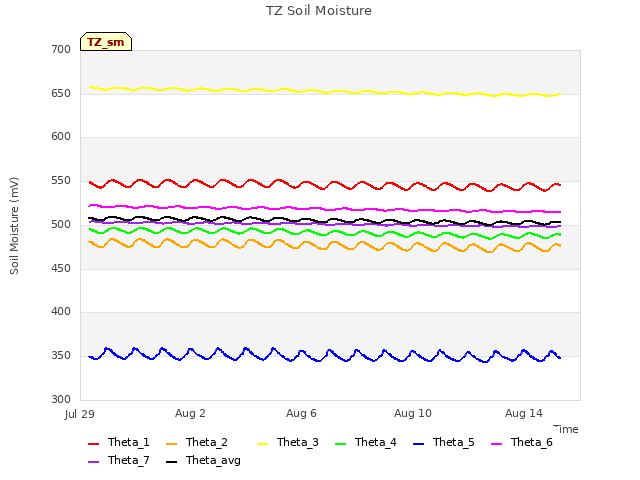
2 TZ_sm graphs found

Can't check TZ_met
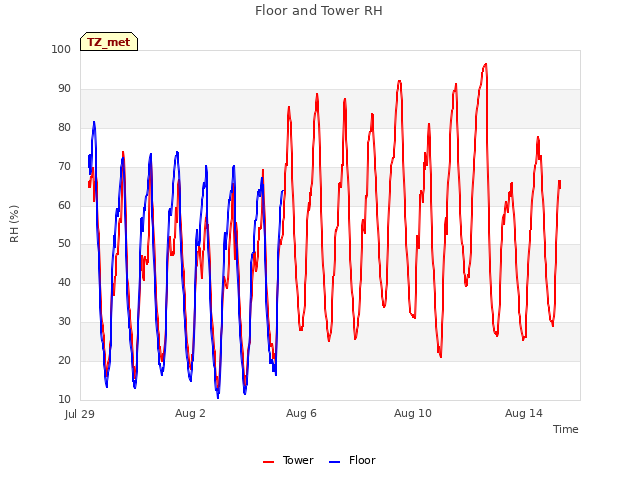
1 TZ_met graphs found
Can't check TZVR_mixed
No data found for TZ_osu.
No data found for TZ_fd.
Tonzi Z-cam data