Field Notes
<--2014-04-17 11:00:00 | 2014-05-07 10:45:00-->Other sites visited today: Sherman Island | Twitchell Rice | East End
Phenocam link: Searching...
Mayberry: 2014-04-28 10:15:00 (DOY 118)
Author: Cove Sturtevant
Others: Joe, Sara
Summary: Site continues to green up. Tules growing taller than cattails. Some tower maintenance. Put 7500, 7700, 7550 on permament tower and used permament tower instruments for portable tower. Set up portable tower at NW site.
| Mayberry 2014-04-28 Permanent Tower We arrived around 10:15 PDT. It was sunny, warm, and breezy. The site continues to green quickly. The tules are growing taller than the cattails and almost all the tules are flowering. Joe built a new mount for the 7550 and 7700 washer boxes. Very nice. Sara and I downloaded data and swapped the gas analyzers with the ones from Ameriflux so that we put our own analyzers on the portable tower (in case we drive the truck off the berm and go swimming). 7500: Removed sn 75H-2176, installed sn 75H-2339. 7700: Removed sn TG1-0224, installed sn TG1-0352. 7550: Removed sn AIU-0397, installed sn AIU-0915. We used the Ameriflux cables on the portable tower. While swapping the instruments, the connector for our Ethernet cable to connect the computer broke. Joe pulled it for repair. 7500 readings: CO2: 402 ppm (same after cleaning, same after swap) H2O: 530 mmol m-3 (485 after cleaning, same after swap) signal strength = 88.32% (89.09% after cleaning, 93.2% after swap) t: 21.9 °C p = 102.3 kPa sos = 343.7 m s-1 Current 7700 readings: CH4 = 1.93 ppm (1.95 ppm after cleaning, same after swap) RSSI = 32-35% variable (82% after cleaning, 76% after swap) Reservoir was full because mirror spinner is broken. Seems to be holding RSSI ok tho. Met looked great. Portable Tower We set up the portable tower in the back of Dennis’ truck (larger truck than 2012). Setup looks great. We put the truck at a site on the eastern edge of the NW quadrant that has a nice window to a large area of open water. The goal this summer is to get as close to the endmembers of 100% water and 100% veg as we can. Will take GPS reading next time. Tower details: 7500 sn 75H-2176 7700 sn TG1-0224 7550 sn AIU-0397 Tower height = 4.9m to water surface (water surface is about 60cm below the berm). There is a large swath of vegetation to the south of the tower which was about 2.1 m high above the water line. The vegetation present at the site is a mix of old and new vegetation. See photos of tower footprint. There was a small wiring problem in the sonic connector that Joe fixed in the field. Readings looked good after that: CO2: 399 ppm H2O: 516 mmol m-3 signal strength = 88.8% t: 21.5 °C p = 102.2 kPa sos = 344.2 m s-1 |
5 photos found

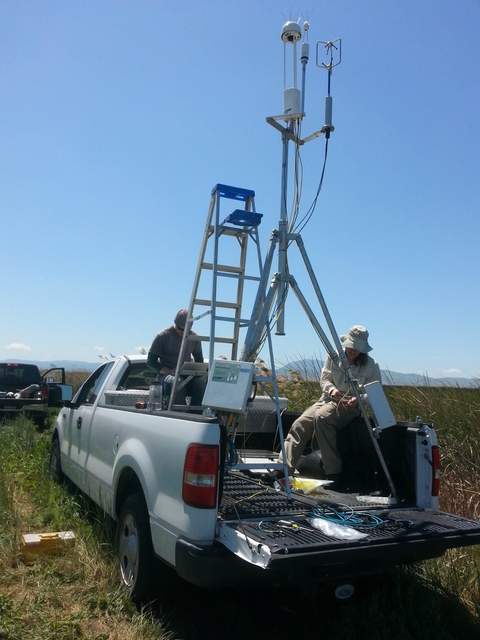
20140428MB_PTowerSettingUp2.jpg ( 2014-04-28 12:48:00 ) Full size: 1920x1440
Setting up the portable tower on the back of Dennis's truck

20140428MB_PTowerSettingUp1.jpg ( 2014-04-28 12:48:00 ) Full size: 1080x1440
Setting up the portable tower on the back of Dennis's truck

20140428MB_PTowerFootprint.jpg ( 2014-04-28 12:48:00 ) Full size: 1080x1440
Footprint of portable tower
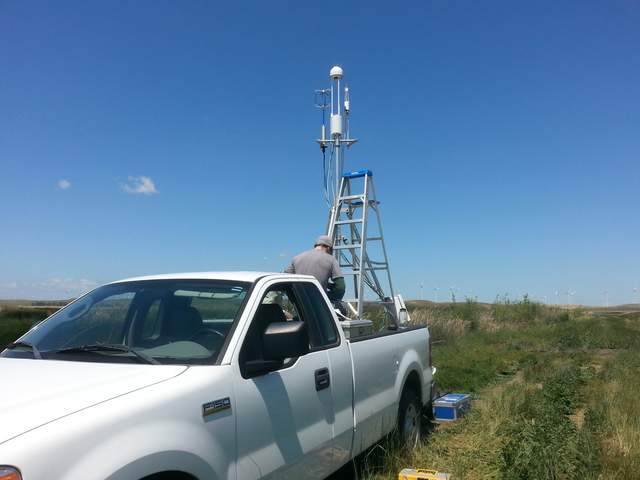
20140428MB_JoeOnPTtruck_small.JPG ( 2014-04-28 12:38:19 ) Full size: 1296x968
Setting up the portable tower on the back of Dennis's truck
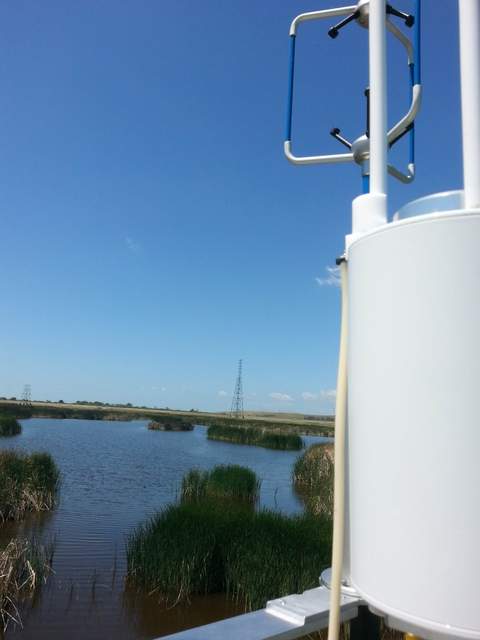
20140428MB_NW2014_view270N_small.JPG ( 2014-04-28 12:39:51 ) Full size: 1296x968
View from portable tower
11 sets found
7 MB_flux graphs found
No data found for MB_met.
28 MB_tule graphs found
Can't check MBWPEESWGT_mixed
1 MB_cam graphs found
Can't check MBEEWPSWEPGT_cam
Can't check SIMBTWEE_met
No data found for MB_minidot.
Can't check MBSWEEWPBCBA
1 MB_processed graphs found
Can't check MB_fd
1 MB_fd graphs found

