
Field Notes
<--2014-03-27 00:00:00 | 2014-04-22 05:45:00-->Phenocam link: Searching...
Tonzi: 2014-04-08 06:30:00 (DOY 98)
Author: Siyan Ma
Others:
Summary: Standard field work, pre-dawn water potential, installed new CO2 soil probes
|
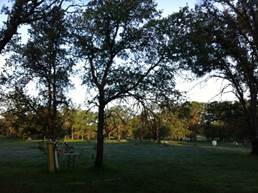
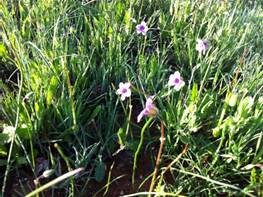
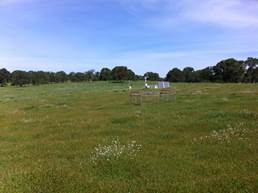
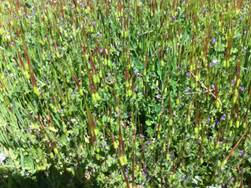
When: Date: 4/8/2014 , Day: 98 , Watch Time: 6:30 am . Where: Tonzi/Vaira Ranch Who: Siyan Weather: clear, sunny, a perfect spring day Phenology: oak leaves expanded; grassland had while, purpl flowers.
Summary
Vaira_Grass Site
Tonzi_Tower Site
Is the pump running‌ YES!  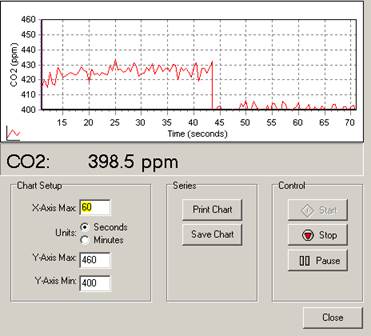 9. closed gate and set up fence. YES! Toniz_Floor Site
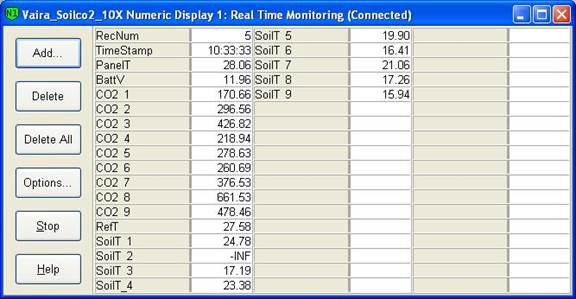
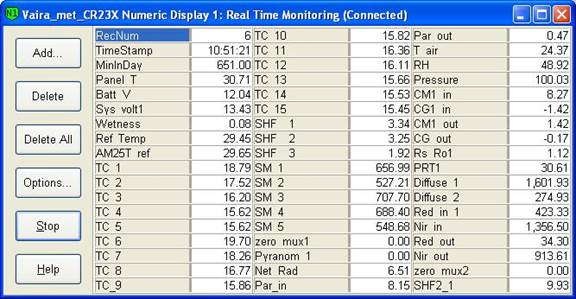
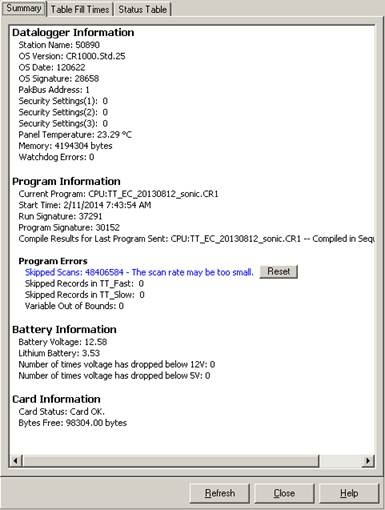
CR23X3 – floor-Met CR23X6 – tower-Met CR10X2 – floor-Met Soil CO2 profile: CR23X5 – soil CO2 profile 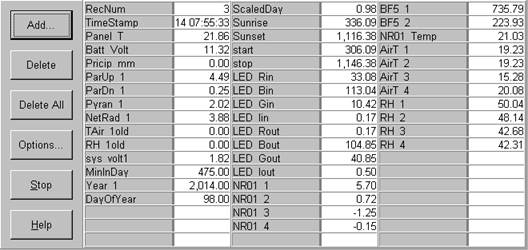 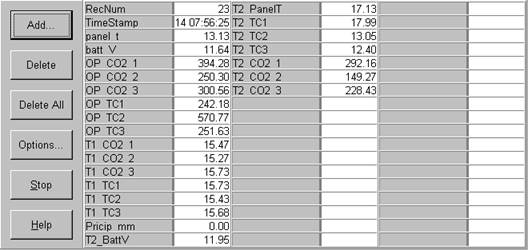 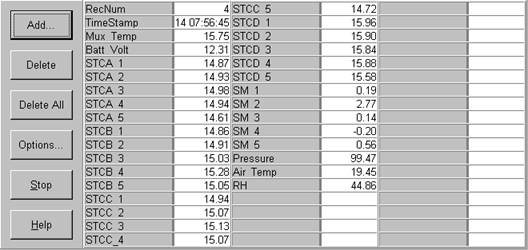 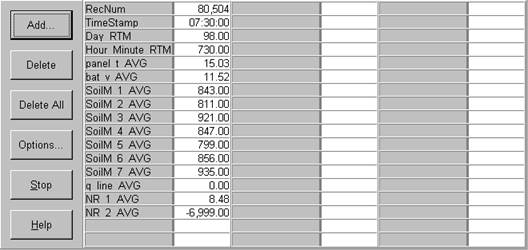
Other Notes:
Soilco2profile: |
Veg Height (cm): Tape measure from ground to top of plant
15, 9, 10, 8, 7, 14, 11, 13, 16, 14, 10, 19, avg = 12.2, stdev = 3.59
Field Data
CO2 Profile Tanks
| Date | Tank | Pressure (psi) | ppm |
|---|---|---|---|
| 2014-04-08 | CO2 | 2000 | 402.68 |
| 2014-04-08 | N2 | 700 | 0 |
Well Depth
| Date | Location | Depth (feet) |
|---|---|---|
| 2014-04-08 | TZ_floor | 30.4 |
| 2014-04-08 | TZ_road | 38.7 |
| 2014-04-08 | TZ_tower | 33.9 |
mode = both
Moisture Point Probes TZ
Array
(
[0] => Tower_1
[1] => Floor_South_1
[2] => Floor_East_1
[3] => Floor_West_1
[4] => SoilCO2_1
[5] => Soil_Transect_4_1
[6] => Soil_Transect_3_1
[7] => Soil_Transect_2_1
[8] => Soil_Transect_1_1
[9] => SoilCO2_West_A_1
[10] => SoilCO2_West_B_1
[11] => SoilCO2_West_C_1
[12] => Tower_2
[13] => Floor_South_2
[14] => Floor_East_2
[15] => Floor_West_2
[16] => SoilCO2_2
[17] => Soil_Transect_4_2
[18] => Soil_Transect_3_2
[19] => Soil_Transect_2_2
[20] => Soil_Transect_1_2
[21] => SoilCO2_West_A_2
[22] => SoilCO2_West_B_2
[23] => SoilCO2_West_C_2
[24] => Tower_3
[25] => Floor_South_3
[26] => Floor_East_3
[27] => Floor_West_3
[28] => SoilCO2_3
[29] => Soil_Transect_4_3
[30] => Soil_Transect_3_3
[31] => Soil_Transect_2_3
[32] => Soil_Transect_1_3
[33] => SoilCO2_West_A_3
[34] => SoilCO2_West_C_3
[35] => Tower_4
[36] => Floor_South_4
[37] => Floor_East_4
[38] => SoilCO2_4
[39] => Soil_Transect_4_4
[40] => Soil_Transect_3_4
[41] => Soil_Transect_2_4
[42] => Soil_Transect_1_4
[43] => SoilCO2_West_A_4
[44] => SoilCO2_West_B_4
[45] => SoilCO2_West_C_4
[46] => SoilCO2_West_B_3
[47] => Floor_West_4
)
| Date | DOY | Rep | Depth | Tower_1 |
Floor_South_1 |
Floor_East_1 |
Floor_West_1 |
SoilCO2_1 |
Soil_Transect_4_1 |
Soil_Transect_3_1 |
Soil_Transect_2_1 |
Soil_Transect_1_1 |
SoilCO2_West_A_1 |
SoilCO2_West_B_1 |
SoilCO2_West_C_1 |
Tower_2 |
Floor_South_2 |
Floor_East_2 |
Floor_West_2 |
SoilCO2_2 |
Soil_Transect_4_2 |
Soil_Transect_3_2 |
Soil_Transect_2_2 |
Soil_Transect_1_2 |
SoilCO2_West_A_2 |
SoilCO2_West_B_2 |
SoilCO2_West_C_2 |
Tower_3 |
Floor_South_3 |
Floor_East_3 |
Floor_West_3 |
SoilCO2_3 |
Soil_Transect_4_3 |
Soil_Transect_3_3 |
Soil_Transect_2_3 |
Soil_Transect_1_3 |
SoilCO2_West_A_3 |
SoilCO2_West_C_3 |
Tower_4 |
Floor_South_4 |
Floor_East_4 |
SoilCO2_4 |
Soil_Transect_4_4 |
Soil_Transect_3_4 |
Soil_Transect_2_4 |
Soil_Transect_1_4 |
SoilCO2_West_A_4 |
SoilCO2_West_B_4 |
SoilCO2_West_C_4 |
SoilCO2_West_B_3 |
Floor_West_4 |
Avg | Spacial Count |
Measurement Count |
|---|---|---|---|---|---|---|---|---|---|---|---|---|---|---|---|---|---|---|---|---|---|---|---|---|---|---|---|---|---|---|---|---|---|---|---|---|---|---|---|---|---|---|---|---|---|---|---|---|---|---|---|---|---|---|
| 2014-04-08 | 98 | 0 | nan | 39.3 | 28.5 | 39.9 | 31.4 | 32.3 | 28.8 | 33.2 | 20.9 | 20.9 | 28.5 | 21.2 | 25 | 39.9 | 38.1 | 50 | 35.6 | 32.3 | 28 | 50 | 31.6 | 18.5 | 27.1 | 29.5 | 33.2 | 40.7 | 45.5 | 58 | 37.7 | 44.4 | 29.9 | 26.2 | 33.8 | 32.7 | 34.9 | 38 | 41.4 | 52.9 | 41.4 | 39.7 | 34.8 | 41.4 | 48 | 29.4 | 33.4 | 56.1 | 53.1 | |||||
| 2014-04-08 | 98 | 1 | nan | 36.1 | 28.5 | 39.9 | 30.5 | 32.3 | 27.6 | 22.6 | 18.5 | 20.3 | 29.1 | 25.6 | 25 | 38.4 | 38.1 | 55.5 | 49.9 | 31.9 | 28.3 | 33.8 | 31 | 18.5 | 26.8 | 19.6 | 33.2 | 42.4 | 45.2 | 51 | 41.4 | 44.1 | 30.1 | 39.6 | 33.5 | 32.8 | 33.8 | 37.4 | 37.4 | 56.9 | 66.6 | 40.8 | 34.2 | 41.4 | 47.7 | 29.4 | 50.9 | 52.5 | 53.1 | 34.6 | ||||
| 2014-04-08 | 98 | 2 | nan | 32.4 | 22.6 | 38.4 | 33.5 | 42.4 | 24 | 41.4 | 50.9 | |||||||||||||||||||||||||||||||||||||||||||
| 2014-04-08 | 98 | Avg | 0-15cm | 0 | 0 | |||||||||||||||||||||||||||||||||||||||||||||||||
| 2014-04-08 | 98 | Avg | 15-30cm | 0 | 0 | |||||||||||||||||||||||||||||||||||||||||||||||||
| 2014-04-08 | 98 | Avg | 30-45cm | 0 | 0 | |||||||||||||||||||||||||||||||||||||||||||||||||
| 2014-04-08 | 98 | Avg | 45-60cm | 0 | 0 |
mode = both
Moisture Point Probes VR
Array
(
[0] => Solar_Panels_1
[1] => Flux_Tower_1
[2] => Gate_1
[3] => Biomass_Cage_1
[4] => Solar_Panels_2
[5] => Flux_Tower_2
[6] => Gate_2
[7] => Biomass_Cage_2
[8] => Solar_Panels_3
[9] => Flux_Tower_3
[10] => Gate_3
[11] => Biomass_Cage_3
[12] => Solar_Panels_4
[13] => Flux_Tower_4
[14] => Gate_4
[15] => Biomass_Cage_4
)
| Date | DOY | Rep | Depth | Solar_Panels_1 |
Flux_Tower_1 |
Gate_1 |
Biomass_Cage_1 |
Solar_Panels_2 |
Flux_Tower_2 |
Gate_2 |
Biomass_Cage_2 |
Solar_Panels_3 |
Flux_Tower_3 |
Gate_3 |
Biomass_Cage_3 |
Solar_Panels_4 |
Flux_Tower_4 |
Gate_4 |
Biomass_Cage_4 |
Avg | Spacial Count |
Measurement Count |
|---|---|---|---|---|---|---|---|---|---|---|---|---|---|---|---|---|---|---|---|---|---|---|
| 2014-04-08 | 98 | 0 | nan | 21.4 | 20 | 11.8 | 4.7 | 27.7 | 26.5 | 26.5 | 19.4 | 27.6 | 11.2 | 33.5 | 28.8 | 42.3 | 26.8 | 20.2 | 31.7 | |||
| 2014-04-08 | 98 | 1 | nan | 18.2 | 20 | 11.8 | 4.7 | 27.4 | 26.8 | 17 | 19.1 | 27.1 | 10.1 | 22.5 | 28.5 | 42.3 | 26.5 | 19.1 | 31.1 | |||
| 2014-04-08 | 98 | 2 | nan | 4.5 | 19.1 | 27.9 | 31.7 | |||||||||||||||
| 2014-04-08 | 98 | Avg | 0-15cm | 0 | 0 | |||||||||||||||||
| 2014-04-08 | 98 | Avg | 15-30cm | 0 | 0 | |||||||||||||||||
| 2014-04-08 | 98 | Avg | 30-45cm | 0 | 0 | |||||||||||||||||
| 2014-04-08 | 98 | Avg | 45-60cm | 0 | 0 |
Grass Height TZ 12
| Date | Height reps (cm) | Location | Average | Samp | STDEV | |||||||||||
|---|---|---|---|---|---|---|---|---|---|---|---|---|---|---|---|---|
| 2014-04-08 | 15 | 9 | 10 | 8 | 7 | 14 | 11 | 13 | 16 | 14 | 10 | 19 | GH_ALL | 12.17 | 12 | 3.44 |
Grass Height VR 12
| Date | Height reps (cm) | Location | Average | Samp | STDEV | |||||||||||
|---|---|---|---|---|---|---|---|---|---|---|---|---|---|---|---|---|
| 2014-04-08 | 23 | 18 | 10 | 19 | 21 | 20 | 35 | 24 | 22 | 23 | 12 | 18 | GH_ALL | 20.42 | 12 | 6.02 |
| 2014-04-08 | 23 | 18 | 10 | 19 | 21 | 20 | 35 | 24 | 22 | 23 | 12 | 18 | GH_FENCED | 20.42 | 12 | 6.02 |
Tree DBH
| Date | Tag# | Reading (mm) |
|---|---|---|
| 2014-04-08 | 102 | 22.9 |
| 2014-04-08 | 2 | 20.9 |
| 2014-04-08 | 245 | 17.0 |
| 2014-04-08 | 3 | 23.2 |
| 2014-04-08 | 4 | 1.1 |
| 2014-04-08 | 5 | 25.9 |
| 2014-04-08 | 7 | 20.5 |
| 2014-04-08 | 72 | 18.1 |
| 2014-04-08 | 79 | 23.2 |
| 2014-04-08 | 8 | 11.9 |
Water Potential - mode: raw
| Time | Species | Tree | readings (bar) | ||||
|---|---|---|---|---|---|---|---|
| 2014-04-08 06:30:00 | OAK | 102 | -2.5 | -2.5 | -2.0 | ||
| 2014-04-08 06:30:00 | OAK | 35 | -3 | -3 | -1.5 | -.5 | -5 |
| 2014-04-08 06:30:00 | OAK | 92 | -2.5 | -2 | -4.5 | ||
| 2014-04-08 07:00:00 | PINE | OLD | -7 | -10 | -6.5 | ||
| 2014-04-08 07:00:00 | PINE | YNG | -5 | -4.5 | -5 | ||
| 2014-04-08 12:47:00 | PINE | OLD | -7 | -18 | -17 | ||
| 2014-04-08 12:47:00 | PINE | YNG | -1 | -10 | -3 | ||
| 2014-04-08 13:00:00 | OAK | 102 | -8 | -15 | -9 | ||
| 2014-04-08 13:00:00 | OAK | 35 | -10.5 | -15.5 | -16.5 | ||
| 2014-04-08 13:00:00 | OAK | 92 | -20 | -15 | -16.5 | ||
No TZ Grass Biomass data found
Biomass TZ OakLeaves
| Date | rep | AREA (cm2) | LEAFNO (count) | LEAFAREA (cm2) | Green WETWT (g) | Green DRYWT (g) | Brown WETWT (g) | Brown DRYWT (g) | Area/Leaf (cm2/leaf) |
Green WETWT/AREA (g/m2) |
Green DRYWT/AREA (g/m2) |
Brown WETWT/AREA (g/m2) |
Brown DRYWT/AREA (g/m2) |
|---|---|---|---|---|---|---|---|---|---|---|---|---|---|
| 2014-04-08 | 0 | 30 | 67.4 | 1.32 | 0.98 | 2.25 | 195.85 | 145.4 | 0 | 0 | |||
| 2014-04-08 | 1 | 30 | 94.0 | 1.99 | 0.88 | 3.13 | 211.7 | 93.62 | 0 | 0 | |||
| 2014-04-08 | 2 | 30 | 94.5 | 2.14 | 0.56 | 3.15 | 226.46 | 59.26 | 0 | 0 | |||
| 2014-04-08 | SUM | ||||||||||||
| 2014-04-08 | CNT | 3 | 3 | 3 | 3 | 3 | 3 | 3 | |||||
| 2014-04-08 | AVG | 2.84 | 211.34 | 99.43 |
Biomass TZ PineNeedles
| Date | rep | AREA (cm2) | LEAFNO (count) | LEAFAREA (cm2) | Green WETWT (g) | Green DRYWT (g) | Brown WETWT (g) | Brown DRYWT (g) | Area/Leaf (cm2/leaf) |
Green WETWT/AREA (g/m2) |
Green DRYWT/AREA (g/m2) |
Brown WETWT/AREA (g/m2) |
Brown DRYWT/AREA (g/m2) |
|---|---|---|---|---|---|---|---|---|---|---|---|---|---|
| 2014-04-08 | 0 | 6 | 27.5 | 2.23 | 1.17 | 4.58 | 810.91 | 425.45 | 0 | 0 | |||
| 2014-04-08 | SUM | ||||||||||||
| 2014-04-08 | CNT | 1 | 1 | 1 | 1 | 1 | 1 | 1 | |||||
| 2014-04-08 | AVG | 4.58 | 810.91 | 425.45 |
0 photos found
16 sets found
No data found for TZ_Fenergy.
11 TZ_tmet graphs found
11 TZ_soilco2 graphs found
Can't check TZ_mixed
3 TZ_mixed graphs found
1 TZ_fflux graphs found
8 TZ_fmet graphs found
1 TZ_tram graphs found
3 TZ_co2prof graphs found
No data found for TZ_irt.
No data found for TZ_windprof.
1 TZ_tflux graphs found
2 TZ_sm graphs found
Can't check TZ_met
1 TZ_met graphs found
Can't check TZVR_mixed
8 TZ_osu graphs found
No data found for TZ_fd.
Tonzi Z-cam data