
Field Notes
<--2014-03-04 09:30:00 | 2014-03-27 00:00:00-->Phenocam link: Searching...
Tonzi: 2014-03-18 09:30:00 (DOY 77)
Author: Siyan Ma
Others:
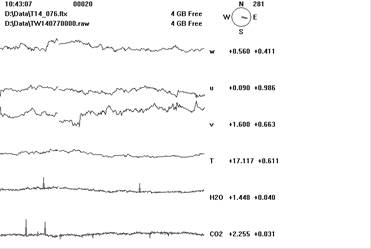
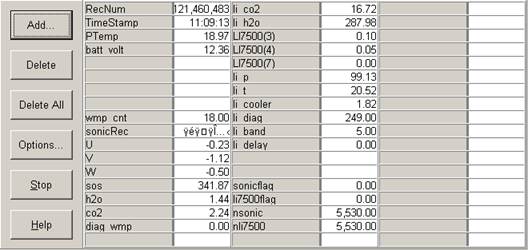
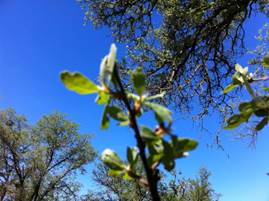
Summary: Oak leaves came out 2 weeks early, CO2 profile CO2 tank empty, Rotated CO2 soil probes, removed one, swapped 7500 at Vaira
|
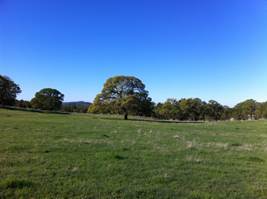
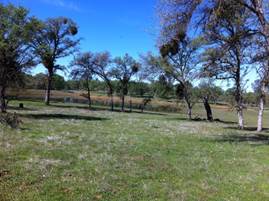
When: Date: 3/18/2014 , Day: 77 , Watch Time: 9:30 am . Where: Tonzi/Vaira Ranch Who: Siyan Weather: clear, sunny, a perfect spring day Phenology: 100% of oak leaves came out at Tonzi, about 2 weeks earlier than multi-year average; no cows at both sites.
Summary
Vaira_Grass Site
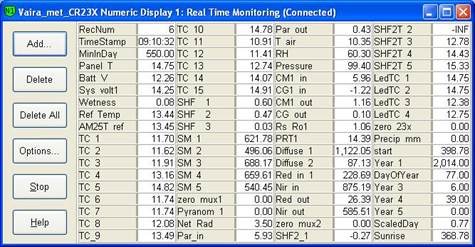 
Tonzi_Tower Site
CO2 tank, 404.02ppm, 0, 18psi N2, , 900, 10 Is the pump running‌ YES! No calibration performed at the site due to the empty CO2 tank. Will be replaced next week.  9. closed gate and set up fence. YES! Toniz_Floor Site
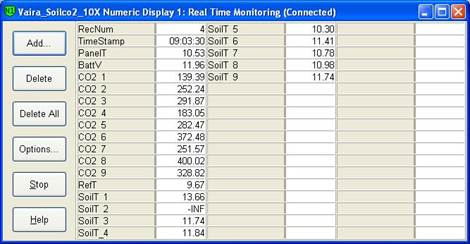
CR23X3 – floor-Met CR23X6 – tower-Met CR10X2 – floor-Met Soil CO2 profile: CR23X5 – soil CO2 profile     
More data collected: Well Depth
Tree DBH
Grass Height
Vaira Soilco2probes rotated West, 1%, sn g0230062, moved from -2cm to -4cm West, 2%, sn y0850004, moved from -4cm to -8cm West, 2%, sn y1720006, moved from -8cm to -2cm East, 3%, sn Y2009100, removed due to malfunction
| |||||||||||||||||||||||||||||||||||||||||||||||||||||||||||||||||||||||||||||||||||||||||||||||||||||||||||||||||
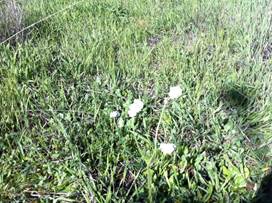
Veg Height (cm): Tape measure from ground to top of plant
10, 5, 4, 4, 2, 5, 4, 1, 2, 4, avg = 4.1, stdev = 2.47
Field Data
No tank data
Well Depth
| Date | Location | Depth (feet) |
|---|---|---|
| 2014-03-18 | TZ_floor | 31.2 |
| 2014-03-18 | TZ_road | 37 |
| 2014-03-18 | TZ_tower | 36 |
mode = both
Moisture Point Probes TZ
Array
(
[0] => Tower_1
[1] => Floor_South_1
[2] => Floor_East_1
[3] => Floor_West_1
[4] => SoilCO2_1
[5] => Soil_Transect_4_1
[6] => Soil_Transect_3_1
[7] => Soil_Transect_2_1
[8] => Soil_Transect_1_1
[9] => SoilCO2_West_A_1
[10] => SoilCO2_West_B_1
[11] => SoilCO2_West_C_1
[12] => Tower_2
[13] => Floor_South_2
[14] => Floor_East_2
[15] => Floor_West_2
[16] => SoilCO2_2
[17] => Soil_Transect_4_2
[18] => Soil_Transect_3_2
[19] => Soil_Transect_2_2
[20] => Soil_Transect_1_2
[21] => SoilCO2_West_A_2
[22] => SoilCO2_West_B_2
[23] => SoilCO2_West_C_2
[24] => Tower_3
[25] => Floor_South_3
[26] => Floor_East_3
[27] => Floor_West_3
[28] => SoilCO2_3
[29] => Soil_Transect_4_3
[30] => Soil_Transect_3_3
[31] => Soil_Transect_2_3
[32] => Soil_Transect_1_3
[33] => SoilCO2_West_A_3
[34] => SoilCO2_West_B_3
[35] => SoilCO2_West_C_3
[36] => Tower_4
[37] => Floor_South_4
[38] => Floor_East_4
[39] => Floor_West_4
[40] => SoilCO2_4
[41] => Soil_Transect_4_4
[42] => Soil_Transect_3_4
[43] => Soil_Transect_2_4
[44] => Soil_Transect_1_4
[45] => SoilCO2_West_A_4
[46] => SoilCO2_West_B_4
[47] => SoilCO2_West_C_4
)
| Date | DOY | Rep | Depth | Tower_1 |
Floor_South_1 |
Floor_East_1 |
Floor_West_1 |
SoilCO2_1 |
Soil_Transect_4_1 |
Soil_Transect_3_1 |
Soil_Transect_2_1 |
Soil_Transect_1_1 |
SoilCO2_West_A_1 |
SoilCO2_West_B_1 |
SoilCO2_West_C_1 |
Tower_2 |
Floor_South_2 |
Floor_East_2 |
Floor_West_2 |
SoilCO2_2 |
Soil_Transect_4_2 |
Soil_Transect_3_2 |
Soil_Transect_2_2 |
Soil_Transect_1_2 |
SoilCO2_West_A_2 |
SoilCO2_West_B_2 |
SoilCO2_West_C_2 |
Tower_3 |
Floor_South_3 |
Floor_East_3 |
Floor_West_3 |
SoilCO2_3 |
Soil_Transect_4_3 |
Soil_Transect_3_3 |
Soil_Transect_2_3 |
Soil_Transect_1_3 |
SoilCO2_West_A_3 |
SoilCO2_West_B_3 |
SoilCO2_West_C_3 |
Tower_4 |
Floor_South_4 |
Floor_East_4 |
Floor_West_4 |
SoilCO2_4 |
Soil_Transect_4_4 |
Soil_Transect_3_4 |
Soil_Transect_2_4 |
Soil_Transect_1_4 |
SoilCO2_West_A_4 |
SoilCO2_West_B_4 |
SoilCO2_West_C_4 |
Avg | Spacial Count |
Measurement Count |
|---|---|---|---|---|---|---|---|---|---|---|---|---|---|---|---|---|---|---|---|---|---|---|---|---|---|---|---|---|---|---|---|---|---|---|---|---|---|---|---|---|---|---|---|---|---|---|---|---|---|---|---|---|---|---|
| 2014-03-18 | 77 | 0 | nan | 34.3 | 25.8 | 39.9 | 33.2 | 21.1 | 30.2 | 39.9 | 21.7 | 17.1 | 27.6 | 22.9 | 25.1 | 37.4 | 36.2 | 30.7 | 39.9 | 35.6 | 27.7 | 32.6 | 30.1 | 19.1 | 24.9 | 16.4 | 32.9 | 42.7 | 42.4 | 39.8 | 33.8 | 36.4 | 27.1 | 11.1 | 33.2 | 34.9 | 35.2 | 34.6 | 11.1 | 41.4 | 57.7 | 41.4 | 40.5 | 31.1 | 34.5 | 25.9 | 52 | 28.8 | 43.4 | 51.4 | 30.5 | |||
| 2014-03-18 | 77 | 1 | nan | 34.1 | 22.6 | 30.2 | 39.9 | 19.4 | 24.7 | 37.4 | 38.4 | 27.1 | 31.6 | 29.8 | 32.7 | 42.4 | 39.6 | 27.1 | 11.1 | 31.8 | 57.2 | 34.2 | 29.9 | 35.4 | 26.2 | 47.7 | 51.1 | |||||||||||||||||||||||||||
| 2014-03-18 | 77 | 2 | nan | 34.6 | 37.8 | 40.5 | 37.1 | |||||||||||||||||||||||||||||||||||||||||||||||
| 2014-03-18 | 77 | Avg | 0-15cm | 0 | 0 | |||||||||||||||||||||||||||||||||||||||||||||||||
| 2014-03-18 | 77 | Avg | 15-30cm | 0 | 0 | |||||||||||||||||||||||||||||||||||||||||||||||||
| 2014-03-18 | 77 | Avg | 30-45cm | 0 | 0 | |||||||||||||||||||||||||||||||||||||||||||||||||
| 2014-03-18 | 77 | Avg | 45-60cm | 0 | 0 |
mode = both
Moisture Point Probes VR
Array
(
[0] => Solar_Panels_1
[1] => Flux_Tower_1
[2] => Gate_1
[3] => Biomass_Cage_1
[4] => Solar_Panels_2
[5] => Flux_Tower_2
[6] => Gate_2
[7] => Biomass_Cage_2
[8] => Solar_Panels_3
[9] => Flux_Tower_3
[10] => Gate_3
[11] => Biomass_Cage_3
[12] => Solar_Panels_4
[13] => Flux_Tower_4
[14] => Gate_4
[15] => Biomass_Cage_4
)
| Date | DOY | Rep | Depth | Solar_Panels_1 |
Flux_Tower_1 |
Gate_1 |
Biomass_Cage_1 |
Solar_Panels_2 |
Flux_Tower_2 |
Gate_2 |
Biomass_Cage_2 |
Solar_Panels_3 |
Flux_Tower_3 |
Gate_3 |
Biomass_Cage_3 |
Solar_Panels_4 |
Flux_Tower_4 |
Gate_4 |
Biomass_Cage_4 |
Avg | Spacial Count |
Measurement Count |
|---|---|---|---|---|---|---|---|---|---|---|---|---|---|---|---|---|---|---|---|---|---|---|
| 2014-03-18 | 77 | 0 | nan | 18.5 | 18.8 | 9.1 | 5.9 | 24.6 | 25.5 | 24.3 | 16.2 | 27.6 | 9.8 | 35.2 | 27.4 | 41.4 | 26.2 | 18.2 | 29.7 | |||
| 2014-03-18 | 77 | 1 | nan | 18.8 | 18.8 | 10.6 | 5 | 25.2 | 24.9 | 16.4 | 16.5 | 27.6 | 9.8 | 21.8 | 27.4 | 41.7 | 26.5 | 18.8 | 29.4 | |||
| 2014-03-18 | 77 | Avg | 0-15cm | 0 | 0 | |||||||||||||||||
| 2014-03-18 | 77 | Avg | 15-30cm | 0 | 0 | |||||||||||||||||
| 2014-03-18 | 77 | Avg | 30-45cm | 0 | 0 | |||||||||||||||||
| 2014-03-18 | 77 | Avg | 45-60cm | 0 | 0 |
Grass Height TZ 10
| Date | Height reps (cm) | Location | Average | Samp | STDEV | |||||||||
|---|---|---|---|---|---|---|---|---|---|---|---|---|---|---|
| 2014-03-18 | 10 | 5 | 4 | 4 | 2 | 5 | 4 | 1 | 2 | 4 | GH_ALL | 4.1 | 10 | 2.34 |
Grass Height VR 10
| Date | Height reps (cm) | Location | Average | Samp | STDEV | |||||||||
|---|---|---|---|---|---|---|---|---|---|---|---|---|---|---|
| 2014-03-18 | 20 | 25 | 20 | 18 | 8 | 25 | GH_FENCED | 19.33 | 6 | 5.71 | ||||
| 2014-03-18 | 11 | 9 | 10 | 2 | 15 | 10 | 8 | 8 | 7 | 10 | GH_OUT | 9 | 10 | 3.13 |
Tree DBH
| Date | Tag# | Reading (mm) |
|---|---|---|
| 2014-03-18 | 102 | 22.9 |
| 2014-03-18 | 2 | 19.9 |
| 2014-03-18 | 245 | 16.2 |
| 2014-03-18 | 3 | 22.3 |
| 2014-03-18 | 4 | 1.5 |
| 2014-03-18 | 5 | 25.5 |
| 2014-03-18 | 7 | 20 |
| 2014-03-18 | 72 | 7.2 |
| 2014-03-18 | 79 | 22.5 |
| 2014-03-18 | 8 | 9.8 |
No water potential data found
No TZ Grass Biomass data found
No TZ OakLeaves Biomass data found
No TZ PineNeedles Biomass data found
0 photos found
16 sets found
No data found for TZ_Fenergy.
11 TZ_tmet graphs found
11 TZ_soilco2 graphs found
Can't check TZ_mixed
3 TZ_mixed graphs found
1 TZ_fflux graphs found
8 TZ_fmet graphs found
1 TZ_tram graphs found
3 TZ_co2prof graphs found
No data found for TZ_irt.
No data found for TZ_windprof.
1 TZ_tflux graphs found
2 TZ_sm graphs found
Can't check TZ_met
1 TZ_met graphs found
Can't check TZVR_mixed
8 TZ_osu graphs found
No data found for TZ_fd.
Tonzi Z-cam data