
Field Notes
<--2014-02-10 10:00:00 | 2014-03-18 09:30:00-->Phenocam link: Searching...
Tonzi: 2014-03-04 09:30:00 (DOY 63)
Author: Siyan Ma
Others:
Summary: Leaf out starting, swapped 7500s on Tower and Floor, No met data collected at Vaira due to dead battery
|
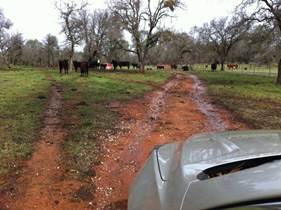
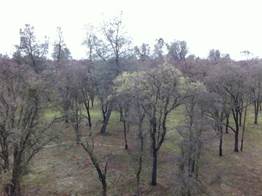
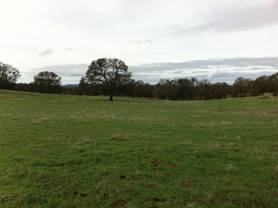
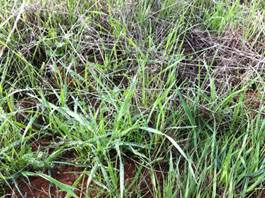
When: Date: 3/4/2014 , Day: 62 , Watch Time: 9:30 am . Where: Tonzi/Vaira Ranch Who: Siyan Weather: cloudy Phenology: (1) the oak tree near Mr.Tonzi’s house had leaves out; ~20 days earlier than multi-year average; another tree near Tower had leaves out, too; not yet the majority of oak trees, though. (2) Grassland turned into green. (3) standing water at Tonzi.
Summary
Vaira_Grass Site
Tonzi_Tower Site
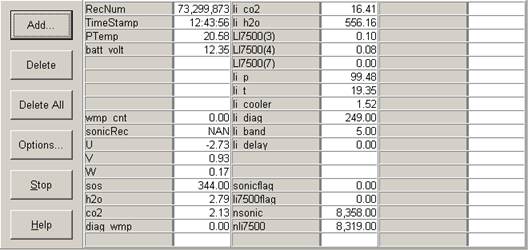
Is the pump running‌ YES! Calibration: did zero but not span because CO2 tank was empty. 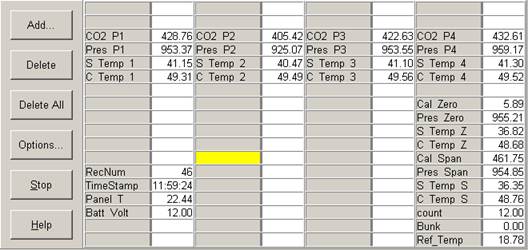
Toniz_Floor Site
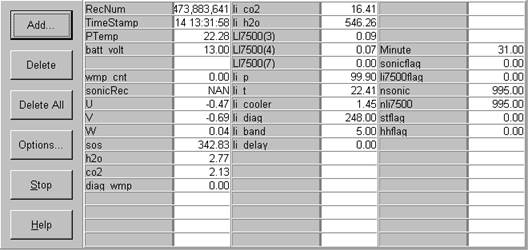
CR23X3 – floor-Met CR23X6 – tower-Met CR10X2 – floor-Met Soil CO2 profile: CR23X5 – soil CO2 profile    
|
Field Data
CO2 Profile Tanks
| Date | Tank | Pressure (psi) | ppm |
|---|---|---|---|
| 2014-03-04 | CO2 | 0 | 404.02 |
| 2014-03-04 | N2 | 900 | 0 |
Well Depth
| Date | Location | Depth (feet) |
|---|---|---|
| 2014-03-04 | TZ_floor | 31.8 |
| 2014-03-04 | TZ_road | 39.7 |
| 2014-03-04 | TZ_tower | 36.8 |
mode = both
Moisture Point Probes TZ
Array
(
[0] => Tower_1
[1] => Floor_South_1
[2] => Floor_East_1
[3] => Floor_West_1
[4] => SoilCO2_1
[5] => Soil_Transect_4_1
[6] => Soil_Transect_3_1
[7] => Soil_Transect_2_1
[8] => Soil_Transect_1_1
[9] => SoilCO2_West_A_1
[10] => SoilCO2_West_B_1
[11] => SoilCO2_West_C_1
[12] => Tower_2
[13] => Floor_South_2
[14] => Floor_East_2
[15] => Floor_West_2
[16] => SoilCO2_2
[17] => Soil_Transect_4_2
[18] => Soil_Transect_3_2
[19] => Soil_Transect_2_2
[20] => Soil_Transect_1_2
[21] => SoilCO2_West_A_2
[22] => SoilCO2_West_B_2
[23] => SoilCO2_West_C_2
[24] => Tower_3
[25] => Floor_South_3
[26] => Floor_West_3
[27] => SoilCO2_3
[28] => Soil_Transect_4_3
[29] => Soil_Transect_3_3
[30] => Soil_Transect_2_3
[31] => Soil_Transect_1_3
[32] => SoilCO2_West_A_3
[33] => SoilCO2_West_B_3
[34] => SoilCO2_West_C_3
[35] => Tower_4
[36] => Floor_South_4
[37] => Floor_East_4
[38] => Floor_West_4
[39] => SoilCO2_4
[40] => Soil_Transect_4_4
[41] => Soil_Transect_3_4
[42] => Soil_Transect_2_4
[43] => Soil_Transect_1_4
[44] => SoilCO2_West_A_4
[45] => SoilCO2_West_B_4
[46] => SoilCO2_West_C_4
)
| Date | DOY | Rep | Depth | Tower_1 |
Floor_South_1 |
Floor_East_1 |
Floor_West_1 |
SoilCO2_1 |
Soil_Transect_4_1 |
Soil_Transect_3_1 |
Soil_Transect_2_1 |
Soil_Transect_1_1 |
SoilCO2_West_A_1 |
SoilCO2_West_B_1 |
SoilCO2_West_C_1 |
Tower_2 |
Floor_South_2 |
Floor_East_2 |
Floor_West_2 |
SoilCO2_2 |
Soil_Transect_4_2 |
Soil_Transect_3_2 |
Soil_Transect_2_2 |
Soil_Transect_1_2 |
SoilCO2_West_A_2 |
SoilCO2_West_B_2 |
SoilCO2_West_C_2 |
Tower_3 |
Floor_South_3 |
Floor_West_3 |
SoilCO2_3 |
Soil_Transect_4_3 |
Soil_Transect_3_3 |
Soil_Transect_2_3 |
Soil_Transect_1_3 |
SoilCO2_West_A_3 |
SoilCO2_West_B_3 |
SoilCO2_West_C_3 |
Tower_4 |
Floor_South_4 |
Floor_East_4 |
Floor_West_4 |
SoilCO2_4 |
Soil_Transect_4_4 |
Soil_Transect_3_4 |
Soil_Transect_2_4 |
Soil_Transect_1_4 |
SoilCO2_West_A_4 |
SoilCO2_West_B_4 |
SoilCO2_West_C_4 |
Avg | Spacial Count |
Measurement Count |
|---|---|---|---|---|---|---|---|---|---|---|---|---|---|---|---|---|---|---|---|---|---|---|---|---|---|---|---|---|---|---|---|---|---|---|---|---|---|---|---|---|---|---|---|---|---|---|---|---|---|---|---|---|---|
| 2014-03-04 | 63 | 0 | nan | 32.9 | 38.7 | 39.9 | 39.9 | 41.7 | 34.3 | 27.9 | 32 | 27.9 | 39.9 | 31.4 | 36.7 | 11.1 | 43.9 | 40.8 | 39.9 | 36.5 | 38.1 | 35.9 | 35.6 | 37.8 | 50 | 47.5 | 37.8 | 45.2 | 48.3 | 39.8 | 42.7 | 34.9 | 35.7 | 35.2 | 38.5 | 39.6 | 36.8 | 37.1 | 36 | 54.6 | 50.6 | 41.4 | 41.4 | 36.2 | 45.4 | 48.6 | 38.8 | 43.7 | 50.3 | 41.4 | |||
| 2014-03-04 | 63 | 1 | nan | 47.5 | 44.6 | 39.3 | 64 | 41.9 | 54.9 | 28.5 | |||||||||||||||||||||||||||||||||||||||||||
| 2014-03-04 | 63 | 2 | nan | 47.2 | 39.9 | 39.6 | 50 | 40.2 | 50.6 | 41.4 | |||||||||||||||||||||||||||||||||||||||||||
| 2014-03-04 | 63 | Avg | 0-15cm | 0 | 0 | ||||||||||||||||||||||||||||||||||||||||||||||||
| 2014-03-04 | 63 | Avg | 15-30cm | 0 | 0 | ||||||||||||||||||||||||||||||||||||||||||||||||
| 2014-03-04 | 63 | Avg | 30-45cm | 0 | 0 | ||||||||||||||||||||||||||||||||||||||||||||||||
| 2014-03-04 | 63 | Avg | 45-60cm | 0 | 0 |
mode = both
Moisture Point Probes VR
Array
(
[0] => Solar_Panels_1
[1] => Flux_Tower_1
[2] => Gate_1
[3] => Biomass_Cage_1
[4] => Solar_Panels_2
[5] => Flux_Tower_2
[6] => Gate_2
[7] => Biomass_Cage_2
[8] => Solar_Panels_3
[9] => Flux_Tower_3
[10] => Biomass_Cage_3
[11] => Solar_Panels_4
[12] => Flux_Tower_4
[13] => Biomass_Cage_4
[14] => Gate_3
[15] => Gate_4
)
| Date | DOY | Rep | Depth | Solar_Panels_1 |
Flux_Tower_1 |
Gate_1 |
Biomass_Cage_1 |
Solar_Panels_2 |
Flux_Tower_2 |
Gate_2 |
Biomass_Cage_2 |
Solar_Panels_3 |
Flux_Tower_3 |
Biomass_Cage_3 |
Solar_Panels_4 |
Flux_Tower_4 |
Biomass_Cage_4 |
Gate_3 |
Gate_4 |
Avg | Spacial Count |
Measurement Count |
|---|---|---|---|---|---|---|---|---|---|---|---|---|---|---|---|---|---|---|---|---|---|---|
| 2014-03-04 | 63 | 0 | nan | 33.8 | 31.7 | 19.4 | 8.3 | 33.5 | 39.9 | 39 | 27.1 | 33.2 | 18.4 | 32.4 | 44.8 | 34.2 | 34.8 | |||||
| 2014-03-04 | 63 | 1 | nan | 33.5 | 28.2 | 17.9 | 8 | 33.5 | 39.6 | 30.7 | 27.7 | 34.3 | 26.8 | 33.5 | 46.6 | 34 | 34.2 | 33.8 | 33.4 | |||
| 2014-03-04 | 63 | Avg | 0-15cm | 0 | 0 | |||||||||||||||||
| 2014-03-04 | 63 | Avg | 15-30cm | 0 | 0 | |||||||||||||||||
| 2014-03-04 | 63 | Avg | 30-45cm | 0 | 0 | |||||||||||||||||
| 2014-03-04 | 63 | Avg | 45-60cm | 0 | 0 |
No TZ grass heigth found
No VR grass heigth found
Tree DBH
| Date | Tag# | Reading (mm) |
|---|---|---|
| 2014-03-04 | 102 | 22.9 |
| 2014-03-04 | 2 | 20 |
| 2014-03-04 | 245 | 16.6 |
| 2014-03-04 | 3 | 22.3 |
| 2014-03-04 | 4 | 1.5 |
| 2014-03-04 | 5 | 25.5 |
| 2014-03-04 | 7 | 19.9 |
| 2014-03-04 | 72 | 17 |
| 2014-03-04 | 79 | 22.5 |
| 2014-03-04 | 8 | 11.2 |
No water potential data found
Biomass TZ Grass
| Date | rep | AREA (cm2) | LEAFNO (count) | LEAFAREA (cm2) | Green WETWT (g) | Green DRYWT (g) | Brown WETWT (g) | Brown DRYWT (g) | LAI (m2/m2) |
Green WETWT/AREA (g/m2) |
Green DRYWT/AREA (g/m2) |
Brown WETWT/AREA (g/m2) |
Brown DRYWT/AREA (g/m2) |
|---|---|---|---|---|---|---|---|---|---|---|---|---|---|
| 2014-03-04 | 0 | 400 | 54.9 | 1.26 | 0.4 | 0.14 | 229.51 | 72.86 | 0 | 0 | |||
| 2014-03-04 | 1 | 400 | 52.2 | 0.67 | 0.28 | 0.13 | 128.35 | 53.64 | 0 | 0 | |||
| 2014-03-04 | 2 | 400 | 121.4 | 2.08 | 0.51 | 0.3 | 171.33 | 42.01 | 0 | 0 | |||
| 2014-03-04 | SUM | ||||||||||||
| 2014-03-04 | CNT | 3 | 3 | 3 | 3 | 3 | 3 | 3 | |||||
| 2014-03-04 | AVG | 0.19 | 176.4 | 56.17 |
No TZ OakLeaves Biomass data found
No TZ PineNeedles Biomass data found
0 photos found
16 sets found
No data found for TZ_Fenergy.
11 TZ_tmet graphs found
11 TZ_soilco2 graphs found
Can't check TZ_mixed
3 TZ_mixed graphs found
1 TZ_fflux graphs found
8 TZ_fmet graphs found
1 TZ_tram graphs found
3 TZ_co2prof graphs found
No data found for TZ_irt.
No data found for TZ_windprof.
1 TZ_tflux graphs found
2 TZ_sm graphs found
Can't check TZ_met
1 TZ_met graphs found
Can't check TZVR_mixed
8 TZ_osu graphs found
No data found for TZ_fd.
Tonzi Z-cam data