
Field Notes
<--2014-01-29 09:30:00 | 2014-02-25 10:40:00-->Other sites visited today: Mayberry | Twitchell Rice | East End | West Pond | Twitchell Alfalfa
Phenocam link: Searching...
Sherman Island: 2014-02-05 09:45:00 (DOY 36)
Author: Cove Sturtevant
Others: Sara
Summary: Regular field work. Reinstalled shadow band, additional CR10x, and new Met program. CO2 profiles reading inverse patterns and thermocouples 4&5 out.
| Sherman 2014-02-05 We arrived about 09:45 PST. It was sunny and cool with a mild breeze. I attended to the tower and downloaded data while Sara took soil respiration, moisture point, well depth, and spectral measurements. I reinstalled the shadow band on the diffuse PAR sensor with a new motor. The new motor revolves faster than the old and thus required the dPAR to be recorded on a separate CR10x sn 31308 with a new program in the main 10x, both of which I installed. Readings looked good after install. 7500 readings: CO2: 17.6 mmol m-3 (same after cleaning) H2O: 385 mmol m-3 (same after cleaning) Diag: 247 (same after cleaning) P = 102.5 kPa T = 14.1 C Sos: 338.8 m s-1 LGR readings: 1.91 ppm, 09:49, 20.03 C, 138.2 Torr (adjusted to 142.3), 14.776 us, 10 Hz Met looked good. I noted that the two profiles of the soil CO2 system had inverse patterns. Concentrations in the first profile (channels 1-3, increasing in depth) went from high to low while concentrations in the second profile (channels 4-6, also increasing in depth) went from low to high. Thermocouples 4 and 5 were not reading. |
1 photos found
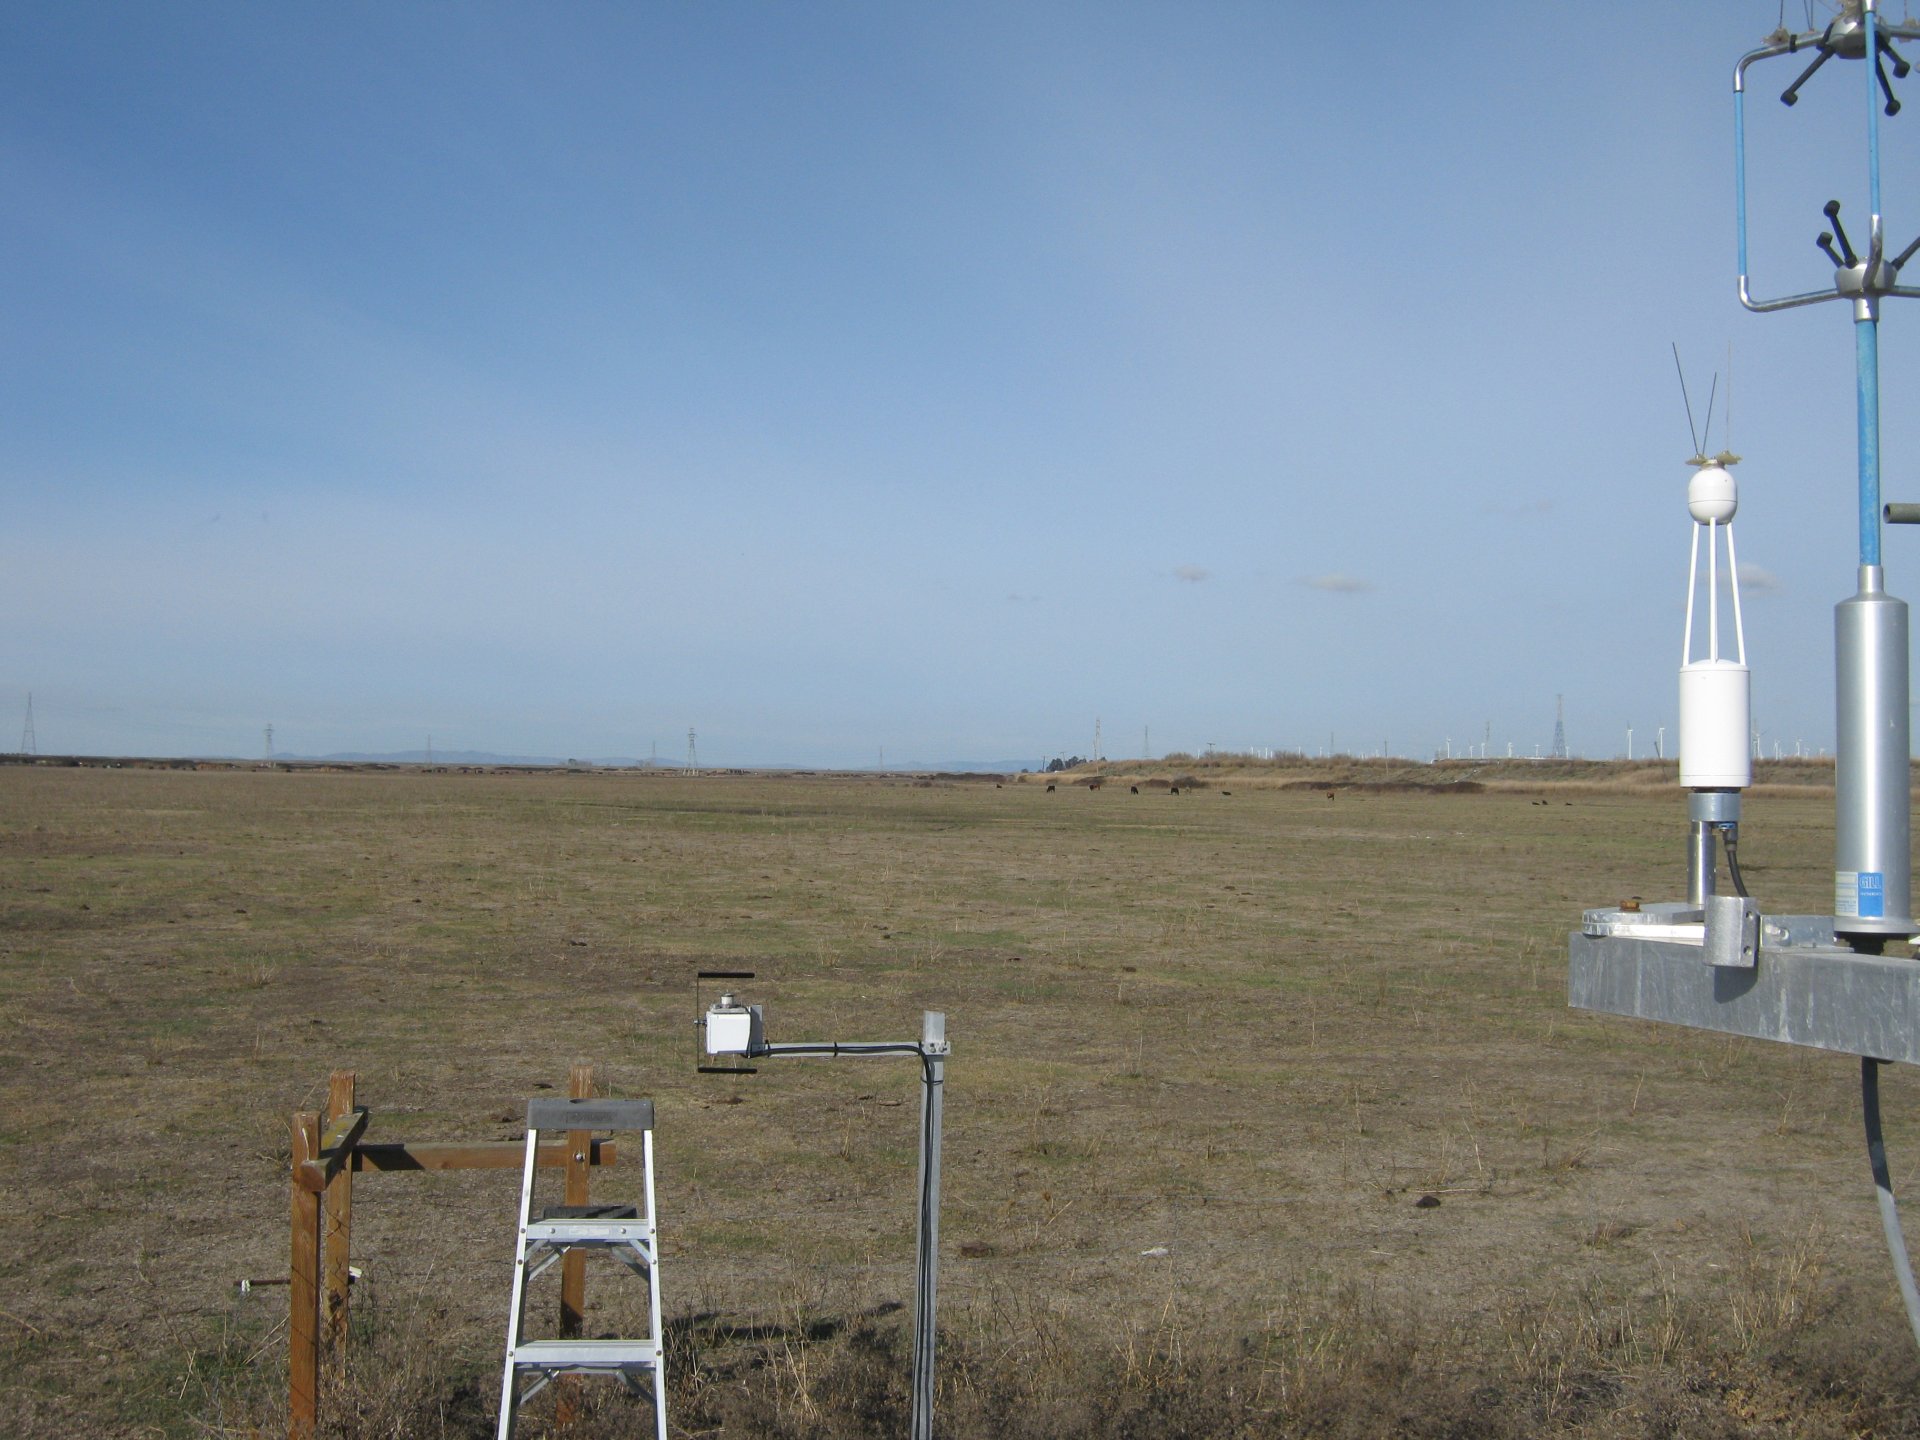
SI_autocam_20140205_1045.jpg ( 2014-02-05 10:45:02 ) Full size: 1920x1440
field visit
7 sets found
No data found for SI_mp.
11 SI_met graphs found
Can't check SI_mixed
2 SI_mixed graphs found
4 SI_flx graphs found
3 SI_soilco2 graphs found
Can't check TWSI_mixed
Can't check SIMBTWEE_met