
Site: Mayberry (MB) aka US-Myb
2010-10-14 - Present
The Mayberry Wetland site is a 300-acre restored wetland on Sherman Island, north of Mayberry Slough, that is on the property of Mayberry Farms and managed by the California Department of Water Resources and Ducks Unlimited. During Summer 2010, the site was restored from a pepperweed and annual grassland pasture to a wetland through a project managed by Bryan Brock (bpbrock@water.ca.gov). A flux tower equipped to analyze energy, H2O, CO2, and CH4 fluxes was installed on October 14, 2010. At the time of installation, flooding of the site had only recently begun after extensive reconstruction of the wetland bathymetry conducted during the summer. Although some small patches of tules remain within the site, the site is a patchwork of deep and shallow open water with some remaining vegetation. Currently, there is an intention to flood-to-kill the current pepperweed and upland grasses and let the wetland plants propagate naturally, so no additional plant manipulation will occur.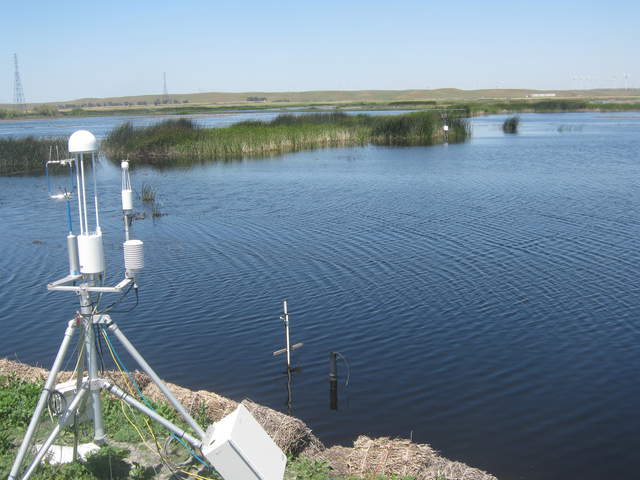
Last field site visit: more fieldnotes
| 2024-05-07 11:05:00 | Greening up, goats have cleared area by tower, sampled 5 sipper profiles, replaced clogged sippers |
Latest data processing: more processing notes
| 2024-05-10 | Met for dates: 2024-01-01 - 2024-04-01 |
| Processor of record: 2013-02-13 - Not Known 2013-06-20 - Cove Sturtevant 2015-08-17 - Patty Oikawa 2016-10-13 - Sam Chamberlain 2018-08-30 - Daphne Szutu 2020-03-27 - Ariane Arias-Ortiz 2022-06-23 - Daphne Szutu |
Ameriflux Author:
20101014 - Jaclyn Hatala Matthes 20101014 - Joseph Verfaillie 20101014 - Dennis Baldocchi 20130328 - Cove Sturtevant 20150708 - Patty Oikawa 20160815 - Samuel D Chamberlain 20161200 - Daphne Szutu 20200327 - Ariane Arias-Ortiz |
Data Digital Object Identifier (DOI)
FLUXNET: https://doi.org/10.17190/AMF/1871139
FLUXNET-CH4: https://doi.org/10.18140/FLX/1669685
AmeriFlux: https://doi.org/10.17190/AMF/1246139
FLUXNET2015: https://doi.org/10.18140/FLX/1440105
Equipment Locations
more details
| Equipment | Start Date | End Date | X | Y | Z | Notes |
|---|---|---|---|---|---|---|
| Anemometer | 2010-10-14 | 2011-10-27 | -5.27 | -9.86 | 3.05 | Original tower location on levee 2.41m agl |
| 2011-10-27 | 2014-03-19 | -5.27 | -9.86 | 3.7 | Eddy sensors raised due to growing wetland plants | |
| 2014-03-19 | 2014-03-27 | 0 | 0 | 4.9 | Moved flux instruments to scaffolding but mounting pole is too short | |
| 2014-03-27 | 2015-01-07 | 0 | 0 | 5.7 | Eddy sensors rasied to correct height, Heading=358 true N | |
| 2015-01-07 | 2022-01-02 | 0 | 0 | 5.44 | New height after tower fixed due to wind damage, Heading=7 true N | |
| 2022-01-02 | 2022-08-01 | 0 | 0 | 5.44 | Sensor swap bc of bad SOS, Heading=7 true N | |
| 2022-08-01 | - | 0 | 0 | 5.44 | Sonic swap, Heading=10 true N | |
| Barrometer | 2011-01-28 | 2014-03-19 | -4.3 | -9.76 | 0.8 | |
| 2014-03-19 | - | 1.93 | -1.07 | |||
| Camera | 2010-11-17 | 2011-04-22 | -1.41 | -11.3 | 3.33 | |
| 2011-04-22 | 2014-03-19 | -2.42 | -12.85 | 3.68 | ||
| 2014-03-19 | - | 1.17 | -2.39 | 5.54 | ||
| CO2 Probe A | 2012-07-26 | 2013-07-16 | -0.1 | probe on fence post in open water, 10cm below water level on install date | ||
| 2014-06-26 | 2014-10-16 | -0.05 | probe on fence post, 5cm below water level on install date | |||
| 2014-10-16 | 2015-06-25 | -0.25 | probe on fence post, 25cm below water level on install date | |||
| 2017-02-23 | 2017-05-25 | -0.1 | probe on static boom, 10cm below water level on install date | |||
| 2017-05-25 | - | -0.15 | probe on floating boom | |||
| CO2 Probe B | 2012-07-26 | 2013-10-16 | -0.1 | probe on fence post in tules, 10cm below water level on install date | ||
| 2014-10-16 | 2015-04-23 | -0.65 | probe on fence post, 65cm below water level on install date | |||
| 2015-04-23 | 2017-02-23 | -0.5 | probe on fence post, 50cm under water level on install date | |||
| 2017-02-23 | 2017-05-10 | -0.38 | probe on fence post, 38cm below water level on install date | |||
| 2017-05-25 | 2018-02-28 | -0.62 | probe on floating boom | |||
| 2018-02-28 | 2020-03-11 | -0.45 | probe on floating boom | |||
| CO2 Probe C | 2014-10-16 | 2015-04-23 | -1.09 | probe on fence post, 109cm below water level on install date | ||
| 2015-04-23 | 2017-02-23 | -0.92 | probe on fence post, 92cm under water level on install date | |||
| 2017-02-23 | 2017-05-10 | -0.68 | probe on static boom, 68cm below water level on install date | |||
| Conductivity Sensor A | 2011-01-28 | 2011-11-08 | Campbell sensor | |||
| 2011-11-22 | 2013-10-26 | |||||
| Conductivity Sensor B | 2016-11-16 | 2017-05-25 | HOBO sensor | |||
| Data Logger Diffuse PAR | 2021-10-21 | - | In box on camera post | |||
| Data Logger Eddy | 2010-10-14 | 2012-04-24 | 0.69 | |||
| Data Logger Met | 2010-10-27 | 2012-01-31 | 0.44 | Only used to collect a few sensors at the beginning | ||
| Data Logger Tule | 2011-03-01 | - | 2 | |||
| DO Sensor A | 2010-10-27 | 2011-05-13 | old MB tower near water surface | |||
| 2011-10-20 | 2013-02-28 | -0.25 | MB tule tower near water surface, 25cm under water level on 2012-09-13 | |||
| 2013-02-28 | 2014-01-10 | -0.1 | MB tule tower near water surface, 10cm under water level on install date | |||
| DO Sensor B | 2011-05-25 | 2014-01-10 | -0.45 | MB tule tower in deeper water, 45cm under water on 2012-09-13 | ||
| DO Sensor C | 2011-03-01 | 2015-09-02 | MB tule tower in tules | |||
| DO Sensor D | 2014-10-09 | 2016-10-11 | -0.25 | probe on fence post in channel, 25cm below water level on install date | ||
| 2017-02-23 | 2017-05-10 | -0.08 | probe on static boom on tower, 8cm below water level on install date | |||
| 2017-05-10 | 2017-05-25 | -0.1 | probe on static boom on tower, 10cm below water level on install date | |||
| 2017-05-25 | 2018-04-19 | -0.17 | probe on floating boom on tower | |||
| 2018-05-31 | - | -0.15 | probe on floating boom on tower | |||
| DO Sensor E | 2014-10-09 | 2015-04-23 | -0.65 | probe on fence post in channel, 65cm below water level on install date | ||
| 2015-04-23 | 2017-02-23 | -0.5 | probe on fence post in channel, 50cm below water level on install date | |||
| 2017-02-23 | 2017-05-10 | -0.38 | probe on static boom on tower, 38cm below water level on install date | |||
| 2017-05-25 | 2018-02-28 | -0.62 | probe on floating boom on tower | |||
| 2018-02-28 | 2019-05-23 | -0.45 | probe on floating boom on tower | |||
| DO Sensor F | 2014-10-09 | 2015-04-23 | -1.09 | probe on fence post in channel, 109cm below water level on install date | ||
| 2015-04-23 | 2017-02-23 | -0.92 | probe on fence post in channel, 92cm below water level on install date | |||
| 2017-02-23 | 2017-05-10 | -0.68 | probe on static boom on tower, 68cm below water level on install date | |||
| Fluorometer | 2017-03-23 | - | ||||
| Forced Diffusion Boom | 2020-05-21 | - | 0 | Water flux | ||
| Gas Analyzer CH4 | 2010-10-14 | 2011-10-27 | -5 | -10 | 2.98 | above normal water level |
| 2011-10-27 | 2014-03-19 | -5 | -10 | 3.63 | Raised due to Tule growth, above normal water level | |
| 2014-03-19 | 2014-03-27 | 0.12 | -0.24 | 4.83 | Moved to scaffolding | |
| 2014-03-27 | 2015-01-07 | 0.12 | -0.24 | 5.63 | Raised | |
| 2015-01-07 | - | 0.12 | -0.24 | 5.37 | New height after scaffolding knocked over by wind | |
| Gas Analyzer CO2/H2O | 2010-10-14 | 2011-10-27 | -4.89 | -9.75 | 3.05 | above normal water level |
| 2011-10-27 | 2014-03-19 | -4.89 | -9.75 | 3.7 | Raised due to Tule growth, above normal water level | |
| 2014-03-19 | 2014-03-27 | 0.41 | -0.05 | 4.9 | Moved to scaffolding | |
| 2014-03-27 | 2015-01-07 | 0.41 | -0.05 | 5.7 | Raised | |
| 2015-01-07 | - | 0.41 | -0.05 | 5.44 | New height after scaffolding knocked over by wind | |
| Heat Flux Plate Vegetation | 2011-03-01 | - | ||||
| Heat Flux Plate Water | 2011-03-01 | - | ||||
| Infrared Temperature Vegetation | 2011-03-01 | 2015-03-24 | Probe facing tules | |||
| Infrared Temperature Water | 2011-03-01 | 2015-03-24 | Probe facing open water | |||
| Interface A547 | 2010-10-14 | 2016-04-13 | ||||
| Interface LI-7550 | 2010-10-14 | - | ||||
| Interface NL115 | 2010-10-14 | 2012-04-24 | ||||
| LED sensor | 2011-12-20 | - | ||||
| Multiplexer Met | 2011-03-01 | - | ||||
| Multiplexer Thermocouple | 2011-03-01 | - | ||||
| Narrow Band NDVI Incoming | 2017-06-05 | - | ||||
| Narrow Band NDVI Reflected | 2017-06-05 | - | ||||
| Net Radiometer 4-way | 2017-01-26 | - | ||||
| Net Radiometer Vegetation | 2011-03-01 | 2011-09-02 | 3.3 | Original tripod near Tules - to normal water level | ||
| 2011-09-02 | 2014-03-13 | 3.65 | Scaffolding near tules - to normal water level | |||
| 2014-03-13 | 2017-01-26 | Scaffolding near berm | ||||
| 2017-01-26 | - | New boom | ||||
| Net Radiometer Water | 2011-03-01 | 2011-09-02 | 2.95 | Original tripod near Tules - to normal water level | ||
| 2011-09-02 | 2014-03-13 | 2.57 | Scaffolding near tules - to normal water level | |||
| 2014-03-13 | - | Scaffolding near berm | ||||
| PAR Sensor Diffuse PAR | 2021-10-21 | - | To the south of camera post near top. | |||
| PAR Sensor Incoming | 2011-03-01 | 2011-09-02 | 3.7 | |||
| 2011-09-02 | 2011-09-29 | 3.7 | Remounted on new scaffolding | |||
| 2011-09-29 | - | 3.8 | Moved from north railing to above SE corner post | |||
| PAR Sensor Reflected Veg | 2011-03-01 | 2011-09-02 | 3.3 | |||
| 2011-09-02 | - | 3.65 | Remounted on new scaffolding | |||
| PAR Sensor Reflected Water | 2011-03-01 | 2011-09-02 | 3.2 | |||
| 2011-09-02 | - | 2.57 | Remounted on new scaffolding | |||
| Precipitation | 2015-06-25 | - | ||||
| RH & Temp | 2010-10-14 | - | ||||
| Thermocouple A | 2011-03-01 | 2014-03-19 | 0.02 | Rod in tules, Tul1Tw2 | ||
| 2014-03-19 | - | -0.32 | Rod in open water, Wat1Ts32 | |||
| Thermocouple B | 2011-03-01 | 2014-03-19 | 0.1 | Rod in tules, Tul1Tw10 | ||
| 2014-03-19 | - | -0.16 | Rod in open water, Wat1Ts16 | |||
| Thermocouple C | 2011-03-01 | 2014-03-19 | 0.04 | Rod in tules, Tul1Tw4 | ||
| 2014-03-19 | - | -0.08 | Rod in open water, Wat1Ts8 | |||
| Thermocouple D | 2011-03-01 | 2014-03-19 | -0.02 | Rod in tules, Tul1Ts2 | ||
| 2014-03-19 | - | 0 | Rod in open water, Wat1Ts0 | |||
| Thermocouple E | 2011-03-01 | 2014-03-19 | 0.04 | Rod in tules, Tul1Ts4 | ||
| 2014-03-19 | - | -0.1 | Rod in open water, Wat1Tw10 | |||
| Thermocouple F | 2011-03-01 | 2014-03-19 | -0.08 | Rod in tules, Tul1Ts8 | ||
| 2014-03-19 | - | 0.3 | Rod in open water, Wat1Tw30 | |||
| Thermocouple G | 2011-03-01 | 2014-03-19 | -0.16 | Rod in tules, Tul1Ts16 | ||
| 2014-03-19 | - | 0.5 | Rod in open water, Wat1Tw50 | |||
| Thermocouple H | 2011-03-01 | 2014-03-19 | -0.32 | Rod in tules, Tul1Ts32 | ||
| 2014-03-19 | - | 1 | Rod in open water, Wat1Tw100 | |||
| Thermocouple I | 2011-03-01 | 2014-03-19 | 0.04 | Rod in tules, Tul2Tw4 | ||
| 2014-03-19 | - | -0.32 | Rod in tules, Tul1Ts32 | |||
| Thermocouple J | 2011-03-01 | 2014-03-19 | -0.02 | Rod in tules, Tul2Ts2 | ||
| 2014-03-19 | - | -0.16 | Rod in tules, Tul1Ts16 | |||
| Thermocouple K | 2011-03-01 | 2014-03-19 | -0.08 | Rod in tules, Tul2Ts8 | ||
| 2011-03-01 | - | -0.08 | Rod in tules, Tul1Ts8 | |||
| Thermocouple L | 2011-03-01 | 2014-03-19 | 0.04 | Rod in tules, Tul3Tw4 | ||
| 2011-03-01 | - | 0 | Rod in tules, Tul1Ts0 | |||
| Thermocouple M | 2011-03-01 | 2014-03-19 | -0.02 | Rod in tules, Tul3Ts2 | ||
| 2011-03-01 | - | 0.1 | Rod in tules, Tul1Tw10 | |||
| Thermocouple N | 2011-03-01 | 2014-03-19 | -0.08 | Rod in tules, Tul3Ts8 | ||
| 2011-03-01 | - | 0.3 | Rod in tules, Tul1Tw30 | |||
| Thermocouple O | 2011-03-01 | 2013-02-21 | 0.1 | Rod in open water, Wat1Tw10 | ||
| 2013-02-21 | 2014-03-19 | -0.32 | Rod in open water, Wat1Ts32 | |||
| 2014-03-19 | - | 0.5 | Rod in tules, Tul1Tw50 | |||
| Thermocouple P | 2011-03-01 | 2013-02-21 | 0.04 | Rod in open water, Wat1Tw4 | ||
| 2013-02-21 | 2014-03-19 | -0.16 | Rod in open water, Wat1Ts16 | |||
| 2014-03-19 | - | 1 | Rod in tules, Tul1Tw100 | |||
| Thermocouple Q | 2011-03-01 | 2013-02-21 | 0.02 | Rod in open water, Wat2Tw2 | ||
| 2013-02-21 | 2014-03-19 | 0 | Rod in open water, Wat1Ts0 | |||
| 2014-03-19 | 2017-03-23 | -0.08 | Rod in tules, Tul2Ts8 | |||
| 2017-03-23 | - | 0.02 | Rod in tules, Tul2Tw2 | |||
| Thermocouple R | 2011-03-01 | 2013-02-21 | -0.02 | Rod in open water, Wat1Ts2 | ||
| 2013-02-21 | 2014-03-19 | 0.1 | Rod in open water, Wat1Tw10 | |||
| 2014-03-19 | 2017-03-23 | 0 | Rod in tules, Tul2Ts0 | |||
| 2017-03-23 | - | -0.02 | Rod in tules, Tul2Ts2 | |||
| Thermocouple S | 2011-03-01 | 2013-02-21 | -0.04 | Rod in open water, Wat1Ts4 | ||
| 2013-02-21 | 2014-03-19 | 0.2 | Rod in open water, Wat1Tw20 | |||
| 2014-03-19 | 2017-03-23 | 0.1 | Rod in tules, Tul2Tw10 | |||
| 2017-03-23 | - | -0.04 | Rod in tules, Tul2Ts4 | |||
| Thermocouple T | 2011-03-01 | 2013-02-21 | -0.08 | Rod in open water, Wat1Ts8 | ||
| 2013-02-21 | 2014-03-19 | 0.3 | Rod in open water, Wat1Tw30 | |||
| 2014-03-19 | 2017-03-23 | -0.08 | Rod in open water, Wat2Ts8 | |||
| 2017-03-23 | - | -0.08 | Rod in tules, Tul2Ts8 | |||
| Thermocouple U | 2011-03-01 | 2013-02-21 | -0.16 | Rod in open water, Wat1Ts16 | ||
| 2013-02-21 | 2014-03-19 | 0.4 | Rod in open water, Wat1Tw40 | |||
| 2014-03-19 | 2017-03-23 | 0 | Rod in open water, Wat2Ts0 | |||
| 2017-03-23 | - | -0.16 | Rod in tules, Tul2Ts16 | |||
| Thermocouple V | 2011-03-01 | 2013-02-21 | -0.32 | Rod in open water, Wat1Ts32 | ||
| 2013-02-21 | 2014-03-19 | 0.5 | Rod in open water, Wat1Tw50 | |||
| 2014-03-19 | 2017-03-23 | 0.1 | Rod in open water, Wat2Tw10 | |||
| 2017-03-23 | - | -0.32 | Rod in tules, Tul2Ts32 | |||
| Thermocouple W | 2011-03-01 | 2014-03-19 | 0.04 | Rod in open water, Wat2Tw4 | ||
| 2014-03-19 | 2017-03-23 | -0.08 | Rod in tules, Tul3Ts8 | |||
| 2017-03-23 | - | 0.04 | Rod in open water, Wat2Tw4 | |||
| Thermocouple X | 2011-03-01 | 2014-03-19 | -0.02 | Rod in open water, Wat2Ts2 | ||
| 2014-03-19 | 2017-03-23 | 0 | Rod in tules, Tul3Ts0 | |||
| 2017-03-23 | - | -0.02 | Rod in open water, Wat2Ts2 | |||
| Thermocouple Y | 2011-03-01 | 2014-03-19 | -0.08 | Rod in open water, Wat2Ts8 | ||
| 2014-03-19 | 2017-03-23 | 0.1 | Rod in tules, Tul3Tw10 | |||
| 2017-03-23 | - | -0.08 | Rod in open water, Wat2Ts8 | |||
| Water Level | 2012-01-17 | 2012-10-24 | 0.6326 | Not sure where cal is from (not in equipment/field notes) | ||
| 2012-10-25 | 2012-10-29 | -0.423 | Sensor swapped | |||
| 2012-10-30 | 2012-11-29 | -0.22 | Sensor moved | |||
| 2012-11-29 | 2014-03-13 | -0.177 | Sensor swapped | |||
| 2014-03-13 | 2015-01-07 | 0.08 | Sensor moved | |||
| 2015-01-07 | 2015-04-09 | -0.06 | Sensor reattached after tower leaned over | |||
| 2015-04-09 | 2015-05-16 | 0.1 | Site visit 2015-04-09 | |||
| 2015-05-16 | 2015-05-21 | 0 | Mysterious change in the middle of the night | |||
| 2015-05-21 | 2016-06-24 | 0.445 | Sensor | |||
| 2016-06-24 | 2016-10-11 | 0.24 | Sensor swapped | |||
| 2016-10-11 | 2018-07-12 | 0.16 | Sensor moved | |||
| 2018-07-12 | 2020-03-11 | 0.095 | Sensor swapped, Height calibrated against staff gauge n=30 R2=96 | |||
| 2020-03-11 | 2023-12-08 | 0.053 | Sensor moved, Height calibrated against staff gauge n=13 R2=99 | |||
| 2023-12-08 | - | Installed HYDROS21 CTD to replace old Campbell sensor |
Data Streams:
more data
| Code | First Day | Last Day | Description |
|---|---|---|---|
| MB_cam | 2010-11-17 | - | RGB digital number data extracted from autocam photos from four photos from 13:25 to 14:45 Phenocam archive |
| MB_fd | 2020-05-21 | 2021-11-23 | Soil CO2 flux from an Eosense Forced Diffusion Chamber, installed in channel on floating boom NW of tower |
| MB_flux | 2010-10-14 | - | 30 minute averages of the 10Hz data recorded on the CR1000 for flux calculations. |
| MB_met | 2010-10-27 | 2012-01-31 | Met data from the Mayberry Wetland began on 10/26/2010. |
| MB_minidot | 2014-10-09 | - | Data from miniDOT dissolved oxygen sensors. 1min readings combined and averaged in post processing. |
| MB_pflux | 2014-04-28 | 2014-10-09 | test |
| MB_pmet | 2014-05-13 | 2014-10-09 | Water temperature and conductivity from the portable tower locations |
| MB_processed | 2010-10-14 | - | Processed data equivalent to L1, L2, L3 and Ameriflux outputs from the Matlab processing. |
| MB_processed3 | 2010-10-14 | - | Gap filling and partitioned data from Level 3 processing |
| MB_tule | 2011-03-01 | - | Temperature, radiation and heat flux from tules and open water. |
Metadata and Data Sets:
more data
| Id | Type | Site | Dates | Frequency | Title | Description |
|---|---|---|---|---|---|---|
| 6 | Lidar | SI, MB, SB | 2007-02-01 | Once | Sherman Island part of DWR Delta wide 2007 Lidar flight | These data are from LIDAR flights of the Sacramento-San Joaquin Delta conducted during late January and February of 2007. The work was conducted under contract issued by California Department of Water Resources to URS Corporation. All data are registered to UTM Zone 10, NAD83, vertical datum NAVD88. The elevation units in the point files are in meters. The elevations for the ESRI grids are in decimeters (done to allow integer type grids to save file size). The bare earth grid is of one meter resolution. The accuracy specifications are as follows: Vertical accuracy: 95% at 0.6’ (<18.5cm) and 90% at 0.5’ (15cm) Horizontal accuracy: 1.0’ (30cm), 1 sigma. |
| 26 | Lidar | BA, BC, EE, MB, SB, SW, TA, WP | 2016-12-01 - 2017-03-07 | Once | Delta-wide USGS Lidar flight | Winter time Lidar flight commissioned by the USGS and flown by Woolpert. Horizontal datum: NAD83 (NSRS2007) Epoch 2017.95, UTM Zone 10N, meters. Vertical datum: NAVD88, GEOID12B, US Survey Feet, Orthometric. Includes classified point cloud, features shape files, bare earth DEM, orthometric imagery (0.3-meter16-bit 4-band RGB-IR tiles in TIFF format with World Files). The entire Delta is covered by 8 points per m2, 0.5m DEM. |
| 3 | Lidar | BA, BC, WP, EP, EE, TA, TW, MB, SB, SW | 2018-09-20 | Once | NCALM Lidar Flight | Lidar flight data collection from Kyle Hemes NCAL project: Ecosystem Structure as a Driver of Climatic, Habitat, and Hydrological Services in Heterogeneous Restored Wetlands. Point clouds (*.las files), 1m resolution DEM and DSM (arcgis GridFloat files), visible imagery (*.tif files) of Sherman, Twitchel and Bouldin Islands. UTM Zone 10N, meters, NAD83(2011) epoch 2010.00 / NAVD88 (GEOID12B) |
| 35 | Soils | WP, MB | 2013-08-30 - 2013-10-14 | Once | Delta-wide soil survey by JGI Susannah Tringe | Soil samples collected by Wyatt Hartman and Susie Theroux from Susannah Tringe's group at LBL. Sites were sampled for bulk density, C/N/anions/elements in the soil and porewater, and microbial communities. Soil samples were incubated in the lab to measure greenhouse gas fluxes. |
| 25 | Soils | SB, BC, EP, EE, BA, SW, MB | 2018-08-27 - 2018-08-28 | Once | Soil cores for C:N and microbial community | Soil samples were collected to be analyzed for soil moisture, bulk density, C:N, and microbial community. Generally at each site, two transects were sampled (T1 to the north, T2 south), starting near the tower and going to the west. Each transect had 5 sampling locations each (P1-P5), each location about 5m apart. At wetland locations (SW, MB, EE, EP, WP), soils were collected at 0-15cm depth. At agricultural locations (BA, BC, SB), soils were collected at 3 depths: 0-15cm, 15-30cm, and 30-60cm. For more information, see the field notes from each day. 2018-08-27 -Sherman Barn: The water table was around 50-60cm. -Bouldin Corn: Transects starting from the first corn rows running parallel away from the tower. Dry peat layer around 60 cm. -Bouldin Alfalfa: Transects starting roughly 5m from the tower. A smaller subsample was taken for microbial analysis. -East End: Transects starting 5-10m from the tower, going west/southwest through dense veg with the T2P4 and T2P5 taken from veg near the open water section. A smaller subsample was taken for microbial analysis. -East Pond: Transects starting about 7m from tower to the west (T1) and southwest (T2). (i.e. after the big open pond section by the solar panels). A smaller subsample was taken for microbial analysis. T2P5 was taken from the more uniformly vegetated area to the west. Other samples were mostly from fairly open water areas near clusters of veg. 2018-08-28 -Mayberry: Two transects (T1 in veg, T2 near the open water) each going northwest of the tower and took microbial subsamples from each core. -Sherman Wetland: We took two transects (T1 to the north, T2 south) going west from the tower starting where the water was about 20 cm deep and following the low vegetation. |
Cospectra_Comparison_Delta.pdf - Plots of cospectra from the Delta sights
MayberryProjectInfo.pdf - DWR prepared brochure for Mayberry Wetland Project
2014_MB_AmerifluxReport.pdf - Ameriflux intercomparison from September 8 - October 2, 2008 at Mayberry
https://youtu.be/VV73O5WCr6Y - Timelapse of Mayberry wetland from 2010-11-17 to 2011-08-09
https://www.youtube.com/watch?v=PLsSODVyQ9o - sub_TIDAL is an audiovisual piece created by algorithmically processed gas exchange data collected over four years at a wetland restoration project on Sherman Island in California’s Delta. Formerly grazed pastures, this developing ecosystem provides critical wildlife habitat for resident and migratory species, and can help reduce pressure on levees critical for the safety of California’s drinking water supply. Additionally, the wetland influences greenhouse gas emissions by storing carbon and releasing methane. To help reveal the invisible forces that structure the developing ecosystem, and to highlight the interdependence between human and natural systems, this project uses Max MSP to translate ecosystem parameters visually (by applying color filters controlled by sensor data to time-lapse imagery) and sonically (by creating melodies using sampled instruments controlled by sensor data). This educational project takes a multi-sensory approach to engage new ways of comprehending local climate dynamics in the context of ecological restoration. This restoration project is managed by the California Department of Water Resources and all data was collected by the Baldocchi Lab at UC Berkeley.
Mayberry Conductivity Comparison
HMP RH and AirT Comparison 12-2017
Delta SW PAR Comparison 10-2016
Mayberry CDOM Data
MB Eosense CO2 Comparison
MB miniDOT Comparison
Water Level sensor calibration with staff gauge
Mayberry conductivity comparision - 2020
Mayberry - NDVI (SRS, Planet)
Picam FWB Rescaling - MB