
Reports
Contents
| Title: | Mayberry conductivity comparision - 2020 | ||||||
| Date: | 2020-11-03 - 2020-11-19 | ||||||
| Data File: | MBCondComp_20201103_rtr.csv | ||||||
| Refers to: | MB,5688,7157 | ||||||
|
Update 2024-02-22 by Daphne: I updated the Campbell conductivity data from 2011-2023 with the factory default TempCoef and gap-filled CondTemp. See this p-note for details: https://nature.berkeley.edu/biometlab/bmetdata/pnotes.php?recno=1148 In mid-August 2020, the temperature from the conductivity sensor sn 5688 started reading values that were too high. We thought this would be a good chance to do do an intercomparison between 2 conductivity sensors, sn 5688 and sn 7157. At Mayberry, conductivity sensor CS547 sn 5688 has been installed since 2016-04-28 with a homemade conductivity board, sn 547-01. Cove did a calibration with the homemade conductivity board: see RT report Calibration for homemade A547 board. Summary of conclusion After re-doing the temperature correction with a good temperature dataset, the sensors had conductivity values in the same ballpark, but their diurnal variations did not really match. I wouldn't calibrate one or the other based on this comparison. Bad temperature-corrected conductivity values from sn 5688 from 2020-08-15 to 2020-11-19 can be corrected by backing out the temperature correction and reapplying the temperature correction with good temperature data.
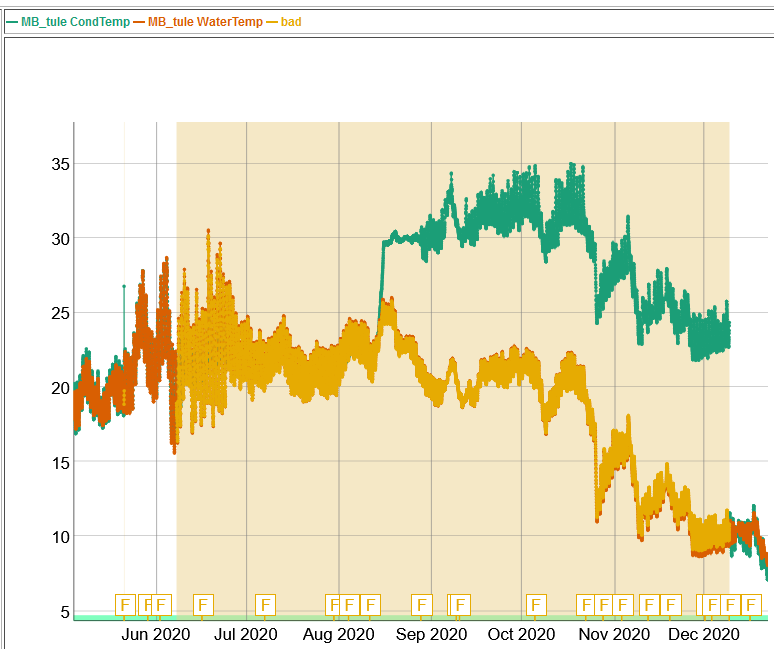
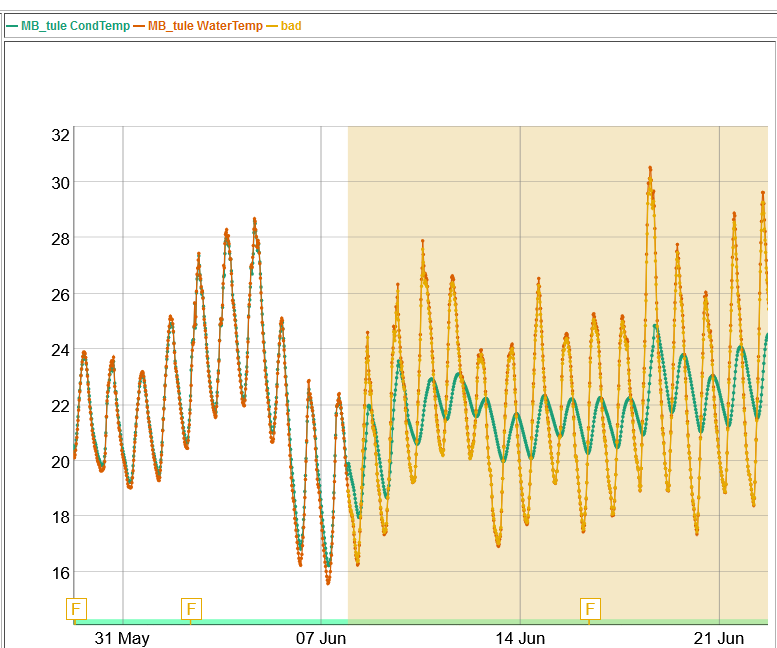
(L) Time series of temperature from conductivity sensor sn 5688 (green line) and from the water level sensor (orange line). The temperature from the conductivity sensor starts to obviously read too high starting in mid-August. (R) Upon closer inspection, the temperature sensor actually starts dying in early June. From 2020-11-03 to 2020-11-19, we installed another conductivity sensor at MB to run a comparison with sn 5688. The comparison sensor was sn 7157 which had been deployed at SW without problems. Both sensors had clean orifices. The new sensor is wired on the CR1000 using the same excitation ports as the old sensor. However, the CS547A manual states "If multiple CS547A/A547s are wired to one datalogger, each conductivity excitation must use a separate excitation port." This is one potential reason why our conductivity comparison did not turn out as well as we expected. Ari secured both conductivity sensors next to each other off the east side of the scaffolding, next to the water level well. She tried to keep them out of the mud. There was a little mud in the old sensor that I pushed out with a reed. Temperature from the old sensor was 29C (too high) and from the new sensor was 17C (reasonable). Figure 1. Time series of raw resistance values from sn 5688 and sn 7157. They match well. Figure 2. Time series of temperature values from sn 5688 and sn 7157. There is clearly something wrong with sn 5688 temperature, as we don't expect water temperature to be 25-30 deg C, especially in November.
Figure 3. Regression between temperature and raw resistance values. Even though the temperature of one sensor is much higher than the other, both sensors have a tight relationship between temperature and raw resistance values.
Calculating conductivity (mScm) From the raw resistance values (Rraw), I calculated conductivity (mScm) in MATLAB because the equations are too complex to plug into the RT report. The equations require sensor-specific constants:
Equations
% For sn 5688, I calculated temperature-corrected conductivity using the temperature from sn 7157
% After calculating the temperature-corrected conductivity, I applied the homemade board calibration that Cove calculated in spring 2016.
Figure 4. Conductivity values for the 2 sensors that were co-located at MB. The purple line is sn 7157, the sensor that was originally at SW and has good temperature data. This sensor seems to get a little weird after Nov 15. The blue line is sn 5688, the sensor at MB that has bad temperature data, so we know this blue line is bad data. The other two lines have additional corrections for sn 5688. The orange line is sn 5688 with the good temperature data from sn 7157. The yellow line is the sn 5688 with temperature from sn 7157 and with an additional correction for the homemade A547 board. Although the yellow and purples lines are in the same ballpark, their diurnal variations don't really match.
Figure 5. Linear regression between the temperature-corrected conductivity values from the two different sensors. I also tried a second regression excluding data >= Nov 15 because the sn 7157 data looked a little weird. Either way, the regressions are not strong. Blue series (Nov 3-19): y=0.7011*x+1.1573, R2=0.14 Red series (Nov 3-14): y=0.6797*x+1.2126, R2=0.12 Potential reasons why the regressions look worse than expected:
But mostly likely, during this period of inter-comparison there just isn't much change in conductivity, and from Figure 3 we see there is a high correlation between Rraw and temperature. Joe's comments: "When you correct for fluctuations in temperature there are no fluctuations left and both sensors are just wandering around the true conductivity of about 3mS/cm. So essentially you have a single point comparison and only know that at 3mS/cm one sensor reads about 0.24 mS/cm lower than the other." Ari's comments: "I was surprised to see how much a bad temperature reading affected the final true conductivity though. When I noticed the probe temperature values started to max out in August, I wasn't really doing anything about them because the final conductivity reading seemed reasonable, but when we added the Sherman probe and did this comparison I realized those were being underestimated due to the bad temperature readings. Also the daily fluctuations observed using the bad temp data are much larger, which is weird considering there aren't new inputs of water."
Correcting for the bad temperature data For the period with bad temperature data (2020-08-15 to 2020-11-03), we were hoping to correct the raw resistance values with temperature data from another water sensor at MB. Unfortunately there was a mistake in the datalogger program so the raw resistance values were not saved correctly (just a long column of ~0). But, I think we can still correct the sn 5688 data from 2020-08-15 to 2020-11-19 by backing out the temperature correction using the original (bad) temperature to get to cond_ct, and then re-apply the temperature correction with a good temperature. |
|||||||


| |