
Reports
Contents
| Title: | Mayberry Conductivity Comparison | ||||||||
| Date: | 2017-04-20 | ||||||||
| Data File: | MB_ConductivityCompare.csv | ||||||||
| Refers to: | MB_met,5688,11020258 | ||||||||
|
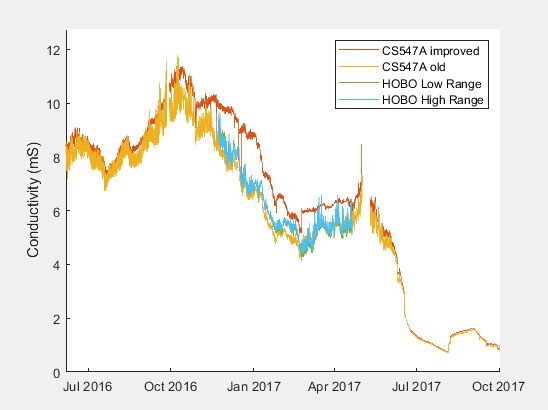
Update 2024-02-22 by Daphne: I updated the Campbell conductivity data from 2011-2023 with the correct TempCoef and gap-filled CondTemp (orange line below). The HOBO data matches better with the old (unimproved) data, although I think the improved data is more defensible. In any case, the Campbell data is probably ok. See this p-note for details: https://nature.berkeley.edu/biometlab/bmetdata/pnotes.php?recno=1148 Joe says: "Yeah, well usually that's the problem - the more measurements you make the more different answers you get. I think the lesson is the uncertainty of that measurement whether due to sensor abilities or just heterogeneity."
From 2016-11-22 to 2017-04-20, a HOBO conductivity logger was compared with the Campbell Scientific conductivity sensor at Mayberry. The HOBO sensor was a U24-002-C sn 11020258 with a range of 100 to 55000 uS/cm and an accuracy of 3% of reading. The Campbell sensors was a CS547A sn 5688 with a range of 5 to 7000 uS/cm and an accuracy of 5% of reading. Part of the reason for the comparison was because salinity at Mayberry had gone above 10000uS/cm, well above the published range of the Campbell sensor, however its reading still seemed reasonable. The HOBO logger was installed when the salinity was near 9000uS/cm and falling. The HOBO outputs two salinity values a high range and a low range. Figure 1. Time series of salinity during the comparison All Three salinity measurements seem reasonable but the Campbell compares better to the high range data from the HOBO.
Figure 2. Regression of the two HOBO salinity measurements against the Campbell measurement. For High range: m = 1.082, b = -281.1. Low range: m = 1.128, b = -592.3. Looking at the differences between the Campbell and the high range HOBO data you can see two distinct periods. These are probably due the fact that the HOBO had to be removed from the water to collect its data. When it was replaced it might have been put back in a different location. The second period has a difference closer to zero but the change in salinity during that period was very small making a separate regression for that time period problematic. Figure 3. The difference of the Campbell measurement minus the HOBO high range measurement show two distinct periods. The two sensors also logged temperature. Figure 4. Temperature from the two sensors. The HOBO experienced some higher temperatures in the second part of the measurement period which are also evident in more noisy conductivity numbers. |
|||||||||
| |