
Field Notes
<--2012-12-19 12:00:00 | 2013-01-16 09:00:00-->Phenocam link: Searching...
Tonzi: 2013-01-01 11:30:00 (DOY 1)
Author: Siyan Ma
Others:
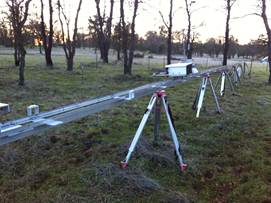
Summary: Floor and Tower fences down, CO2 profile system not working, tram was derailed - reset at charging station, soil co2 partially working
|
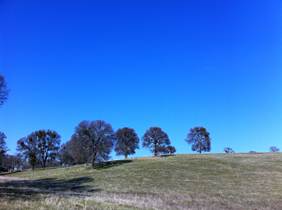
When: Date: 01/01/2013 , Day: 001 , Watch Time: 11:30 am Where: Tonzi/Vaira Ranch Who: Siyan Weather: clear, sunny Phenology: green grasses; no-leaf on oak trees
Summary
Vaira_Grass Site
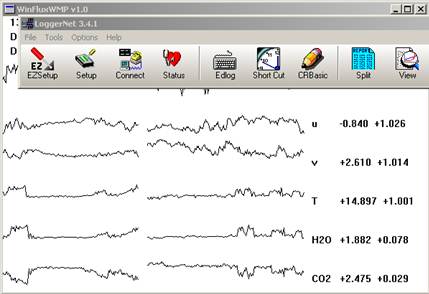
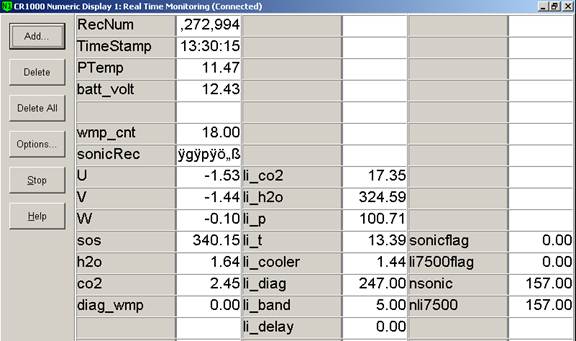
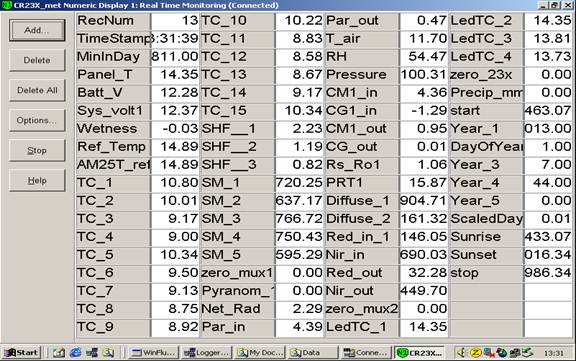
Tonzi_Tower Site
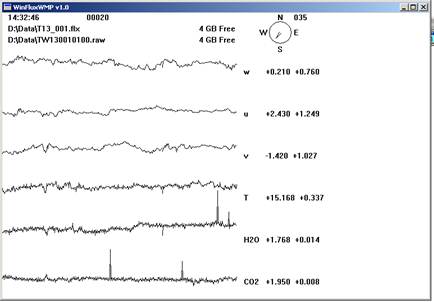
CO2, 600, 20,421.63ppm N2,850,20 Is the pump running YES! 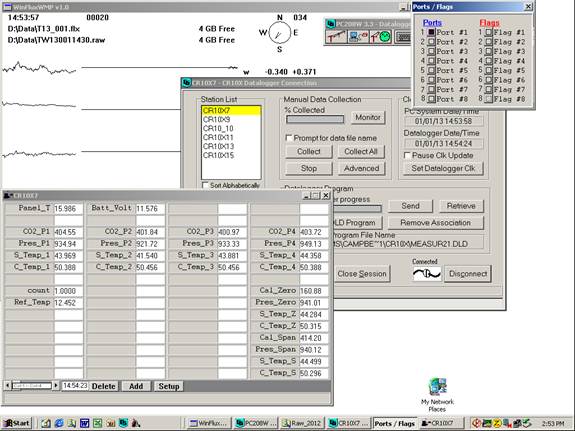
Gashound of CO2 profile system gave 152 ppm when N2 given. So, I didn’t calibrate the system in the field. No daily files were downloaded by the PC. I tried downloading manually, but no data were collected. 
Toniz_Floor Site

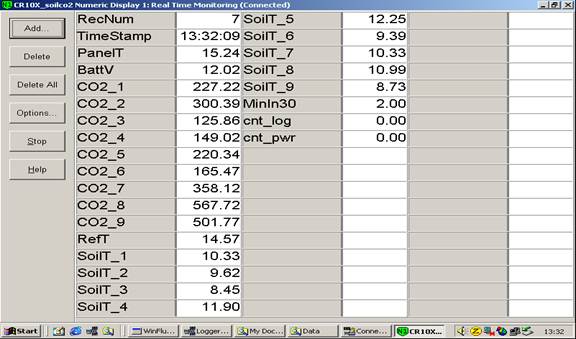
CR23X3 – floor-Met CR23X6 – tower-Met CR10X2 – floor-Met Soil CO2 profile: CR23X5 – soil CO2 profile 

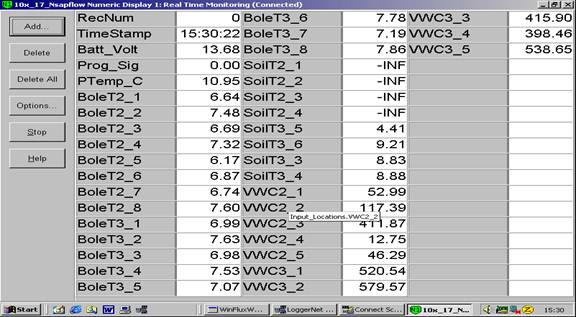
Soil CO2 profile temp INF 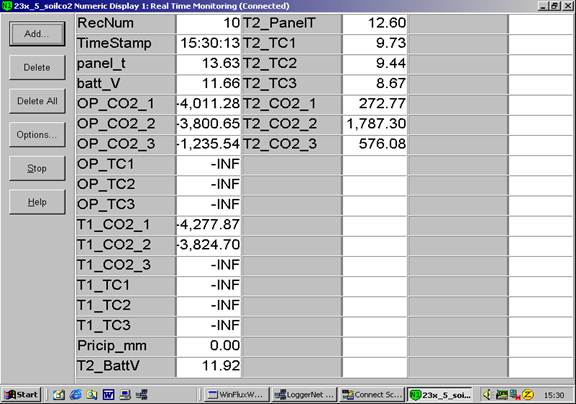
Notes: “X” means not working any more. Dendrometers installed by Gretchen group 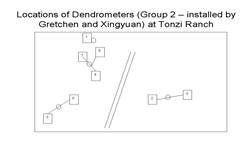
| ||||||||||||||||||||||||||||||||||||||||||||||||||||||||||||||||||||||||||||||||||||||||||||||||||||||||||||||||||||||||||||||||||||||||||||||||||||||||||||||||||||||||||||||||||||||||||||||||||||||||||||||||||||||||||||||||||||||||||||||||||||||||||||||||||||||||||||||||||||||||||||||||||||

Field Data
No tank data
Well Depth
| Date | Location | Depth (feet) |
|---|---|---|
| 2013-01-01 | TZ_floor | 28 |
| 2013-01-01 | TZ_road | 34.3 |
| 2013-01-01 | TZ_tower | 32.4 |
No TZ Moisture Point data found
No VR Moisture Point data found
No TZ grass heigth found
No VR grass heigth found
Tree DBH
| Date | Tag# | Reading (mm) |
|---|---|---|
| 2013-01-01 | 1 | 24 |
| 2013-01-01 | 102 | 17.5 |
| 2013-01-01 | 2 | 18.6 |
| 2013-01-01 | 245 | 13 |
| 2013-01-01 | 3 | 21 |
| 2013-01-01 | 4 | 3.6 |
| 2013-01-01 | 5 | 24 |
| 2013-01-01 | 7 | 17.8 |
| 2013-01-01 | 72 | 14.5 |
| 2013-01-01 | 79 | 15.4 |
| 2013-01-01 | 8 | 9.5 |
No water potential data found
No TZ Grass Biomass data found
No TZ OakLeaves Biomass data found
No TZ PineNeedles Biomass data found
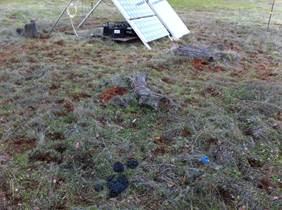
1 photos found

tonzi_2012_12_31_073102.jpg ( 2012-12-31 07:31:24 ) Full size: 1296x960
Frost
16 sets found
No data found for TZ_Fenergy.
11 TZ_tmet graphs found
11 TZ_soilco2 graphs found
Can't check TZ_mixed
3 TZ_mixed graphs found
1 TZ_fflux graphs found
8 TZ_fmet graphs found
1 TZ_tram graphs found
No data found for TZ_co2prof.
No data found for TZ_irt.
No data found for TZ_windprof.
1 TZ_tflux graphs found
2 TZ_sm graphs found
Can't check TZ_met
1 TZ_met graphs found
Can't check TZVR_mixed
8 TZ_osu graphs found
No data found for TZ_fd.
Tonzi Z-cam data