Field Notes
<--2009-09-18 12:00:00 |
2009-10-02 10:30:00-->
Other sites visited today:
Vaira |
Tonzi |
Twitchell Rice
Phenocam link:
Searching...Tonzi: 2009-10-02 09:00:00 (DOY 275)
Author: Siyan Ma
Others: Dennis. Joe
When: Date: 10/2/2009 ,
Day: 275 ,
Watch Time: 9:00 .
Where: Tonzi/Vaira Ranch
Who: Dennis, Joe, Siyan
Weather:
hot, nice breeze
Phenology:
tree litter fall 50%, yellow grass
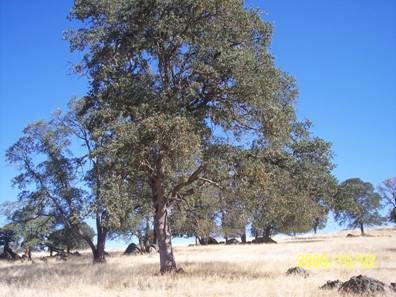
Tonzi
|

|
Vaira
|
|
Summary
- checked and downloaded data at Tower, Floor, and Vaira
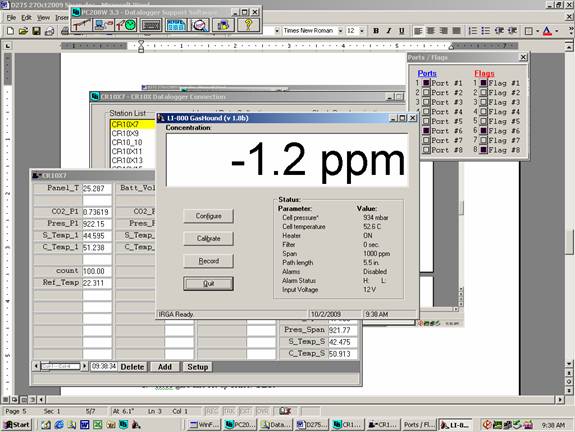
- calibrated Li-800 in the field because bump was dead.
- Comparing all sensors under ambient [CO2] by Dennis
- dendrometers
- soil moisture
- groundwater well:
Date
|
DOY
|
Location
|
Depth
from the black thing (feet)
|
10/2/2009
|
275
|
Floor
|
29.87
|
|
|
Tower
|
34.60
|
|
|
roadside
|
38.01
|
|
|
|
Notes: no black thing
|
Vaira_Grass
Site
- Fence and gate power: 12
v.
- Panel and Batteries: 13.5 v; 10.1 amps; 2.5
amps.
- Reading from Gillsonic screen
before downloading data. (The value
of H2O and CO2 should be in the range of 0 – 5 v.)

- downloading data
- Check the fans of air temp.
and relative humidity sensors at Vaira. YES!
- Check MD-9 system connections
YES!
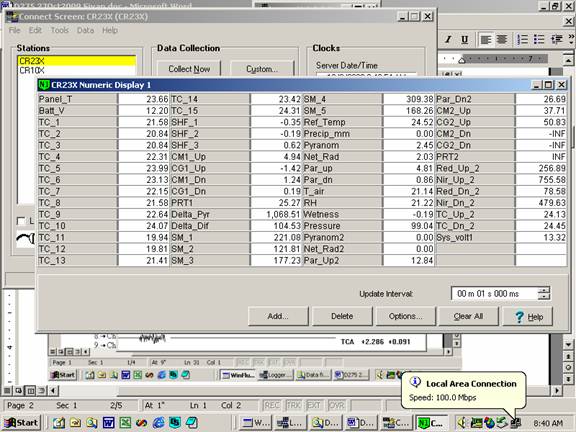
- Check CR23X with two
multiplexers
- Check levels of Radiation sensors,
clear up surfaces.YES!
- Check rain gage, make sure
not clogged. YES!
- Closed gate and set up fence.
YES!
Tonzi_Tower Site
- Fence and gate power: 12
v.
- Panel and Batteries: 14.2
v; 0.0
amps; 4.9
amps.
- Reading from Gillsonic screen
before downloading data. (The value
of H2O and CO2 should be in the range of 0 – 5 v.)

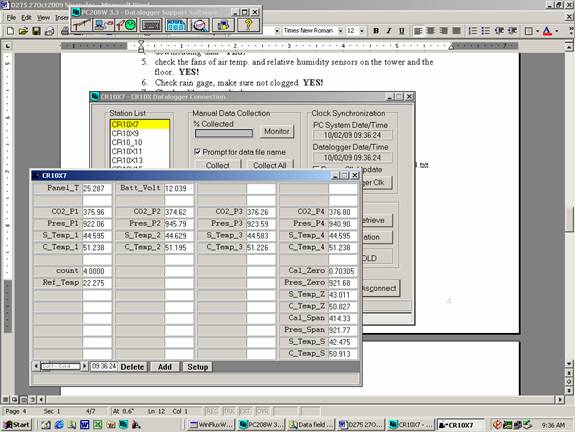
- downloading data YES!
- check the fans of air temp.
and relative humidity sensors on the tower and the floor. YES!
- Check rain gage, make sure
not clogged. YES!
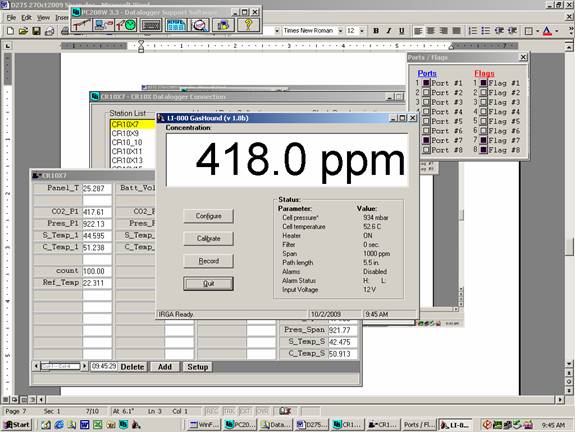
- Check calibration cylinders;
CO 2 2000 psig; flow 20 psi; 418.8
ppm.
N 2 2000 psig; flow 16 psi.
Manually calibrate Li-800. Following Ted’s instruction: H:\IoneSavanna_2004\Tower_2004\CO2Profile\LI800_Calibration_Procedure_2Nov04.txt
Is the pump running
After zero
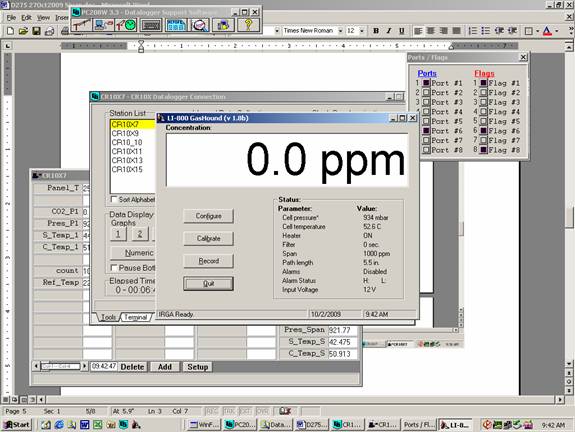
before span
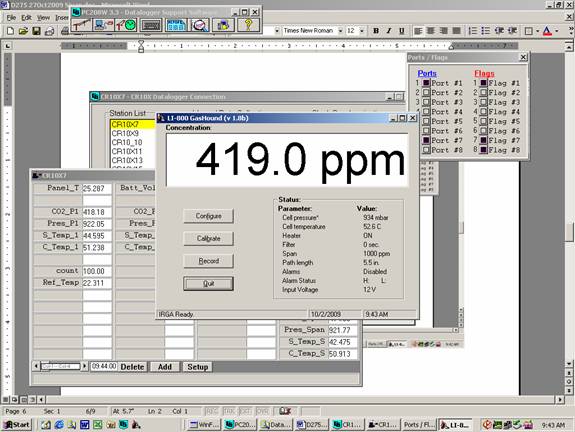
after span
- close gate and set up fence. YES!
Toniz_Floor
Site
- Fence and gate power: 12
v.
- Panel and Batteries: 12.3
v; 1.5
amps; 1.9
amps. (about
7:00 am local time)
- Reading from Gillsonic screen
before downloading data. (The value
of H2O and CO2 should be in the range of 0 – 5 v.)
- downloading data YES!
- Check MD-9 system
connections YES!
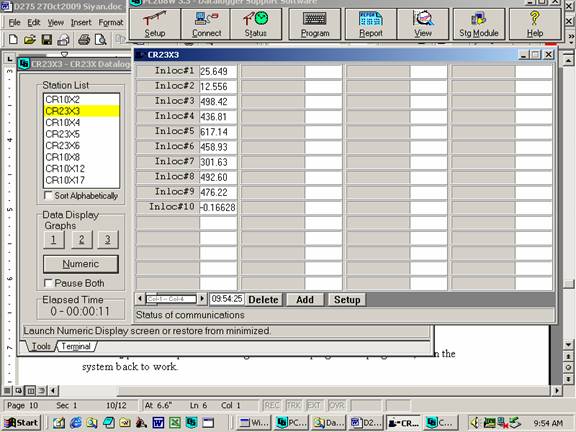
CR23X3 – floor-Met
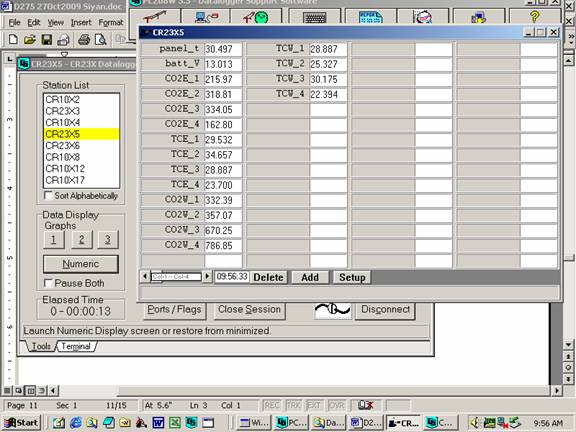
CR23X5 – soil CO 2
profile
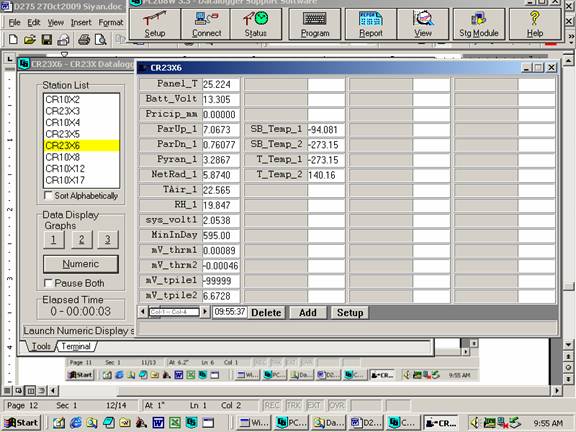
CR23X6 – tower-Met
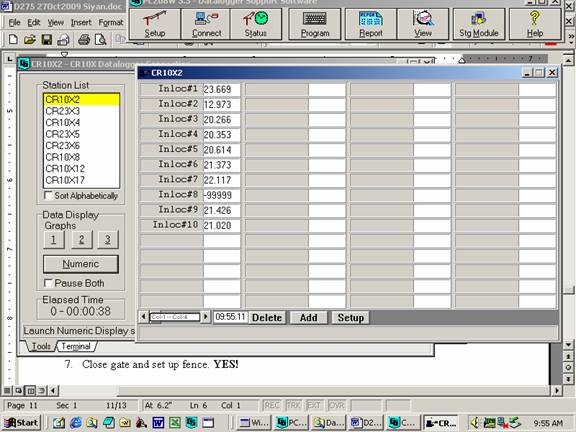
CR10X2 – floor-Met
 Comparing all sensors
under ambient [CO2] by Dennis
Comparing all sensors
under ambient [CO2] by Dennis
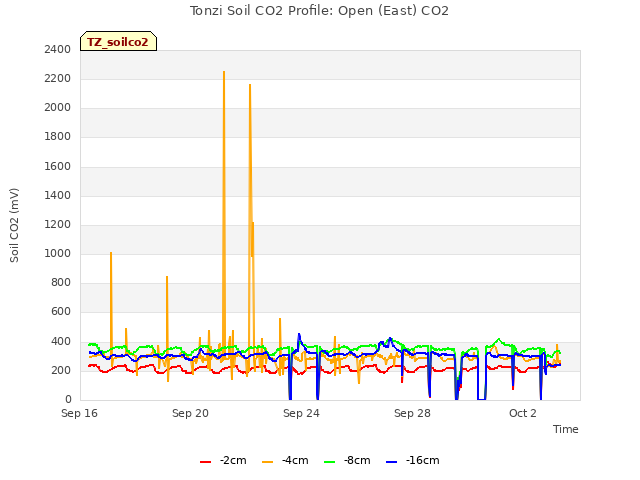
open
|
|
|
|
|
|
|
|
|
|
|
|
ppm
readings
|
|
|
mVolts
|
|
|
|
|
2cm
|
380
|
350
|
340
|
340
|
186
|
177
|
175
|
170
|
|
4cm
|
390
|
370
|
370
|
360
|
190
|
184
|
184
|
184
|
|
8cm
|
520
|
480
|
480
|
470
|
258
|
256
|
247
|
239
|
|
16cm
|
430
|
390
|
370
|
360
|
106
|
102
|
100
|
95
|
open
|
|
|
|
|
|
|
|
|
|
|
redo
after shaking sensor to clean air
|
|
|
|
|
average
|
|
2cm
|
320
|
320
|
|
|
158
|
159
|
156
|
158
|
|
4cm
|
400
|
410
|
|
|
205
|
201
|
198
|
201
|
|
8cm
|
410
|
410
|
|
|
203
|
204
|
212
|
206
|
|
16cm
|
310
|
310
|
|
|
77
|
76
|
76
|
76
|
|
|
|
|
|
|
|
|
|
|
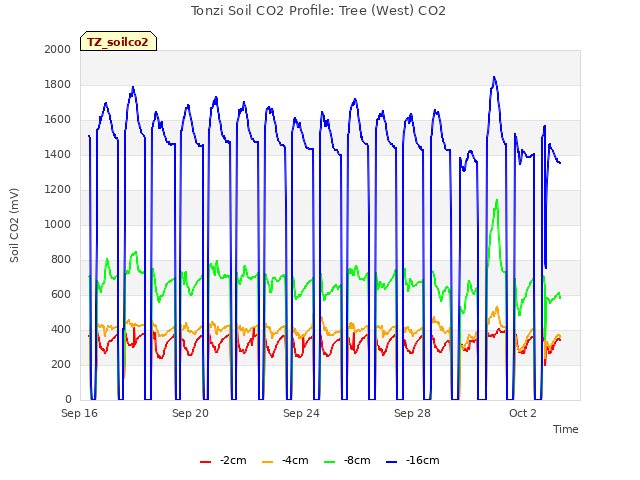
under
trees
|
|
|
|
|
|
|
|
|
|
shaking
sensor to clean air
|
|
|
|
|
|
|
|
2cm
|
290
|
280
|
|
|
138
|
139
|
139
|
139
|
|
4cm
|
360
|
360
|
|
|
177
|
177
|
177
|
177
|
|
8cm
|
420
|
420
|
|
|
208
|
208
|
207
|
208
|
|
16cm
|
440
|
460
|
|
|
108
|
110
|
113
|
110
|
- Close gate and set up fence. YES!
tonzi
|
7931AFE
|
402165
|
574B4B
|
402FF3
|
574632
|
7A432E
|
7A3C6E
|
7A3B40
|
7A4AAA
|
10/2/2009
|
275
|
|
|
|
|
|
|
|
|
|
SM
|
|
|
|
|
|
|
|
|
0-15
|
2.7
|
1.8
|
#DIV/0!
|
0.3
|
4.1
|
5.0
|
5.5
|
3.5
|
2.7
|
15-30
|
12.4
|
9.2
|
12.5
|
12.2
|
6.0
|
5.4
|
11.8
|
11.3
|
3.6
|
30-45
|
17.2
|
13.4
|
11.1
|
13.5
|
12.8
|
8.7
|
13.4
|
15.7
|
12.7
|
45-60
|
12.7
|
2.2
|
10.5
|
9.6
|
11.1
|
10.6
|
12.6
|
19.7
|
10.2
|
|
|
|
|
|
|
|
|
|
|
|
A6D882B
|
A3D04E8
|
A6D72F5
|
|
|
|
|
|
|
|
|
|
|
|
|
|
|
|
|
0-15
|
6.4
|
4.9
|
1.7
|
|
|
|
|
|
|
15-30
|
6.6
|
6.2
|
11.5
|
|
|
|
|
|
|
30-45
|
16.5
|
15.5
|
12.5
|
|
|
|
|
|
|
45-60
|
15.8
|
16.8
|
3.4
|
|
|
|
|
|
|
|
|
|
|
|
|
|
|
|
|
vaira
|
57318a
|
7933dee
|
|
|
|
|
|
|
|
0-15
|
#DIV/0!
|
1.0
|
|
|
|
|
|
|
|
15-30
|
3.4
|
7.4
|
|
|
|
|
|
|
|
30-45
|
7.6
|
10.9
|
|
|
|
|
|
|
|
45-60
|
17.8
|
19.9
|
|
|
|
|
|
|
|
Tonzi
|
|
|
|
|
|
Dendrometer
|
|
|
|
|
|
|
|
|
|
|
Date
|
Day
|
Tag #
|
Reading (mm)
|
|
|
10/2/2009
|
275
|
72
|
3.4
|
|
|
|
|
79
|
6.4
|
|
|
|
|
102
|
9.5
|
|
|
|
|
245
|
6.8
|
|
|
|
|
250
|
14.5
|
(reset to 10.5 on May 7, 2009)
|
|
|
|
1
|
17.8
|
|
|
|
|
2
|
7.3
|
|
|
|
|
3
|
11.8
|
|
|
|
|
4
|
3.9
|
|
|
|
|
5
|
10.9
|
|
|
|
|
7
|
10.8
|
133
|
|
|
|
8
|
13.5
|
11828
|
|
|
|
71
|
X
|
|
|
|
|
77
|
X
|
|
|
|
|
78
|
X
|
|
|
|
|
248
|
X
|
broken
|
|
|
|
255
|
X
|
|
|
|
|
252
|
X
|
|
|
|
|
6
|
X
|
|
|
Notes:
“X” means not working any more.
Dendrometers
installed by Gretchen group

|
Field Data
No tank data
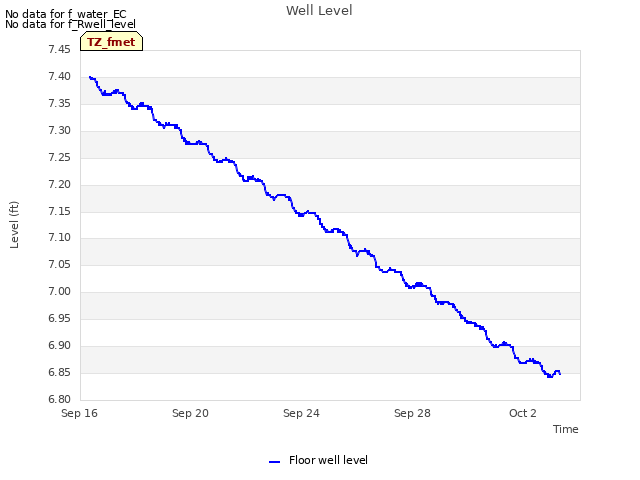
Well Depth
| Date | Location | Depth (feet) |
|---|
| 2009-10-02 | TZ_floor | 29.87 |
| 2009-10-02 | TZ_road | 38.01 |
| 2009-10-02 | TZ_tower | 34.6 |
No TZ Moisture Point data found
No VR Moisture Point data found
No TZ grass heigth found
No VR grass heigth found
No TZ Tree DBH found
No water potential data found
No TZ Grass Biomass data found
No TZ OakLeaves Biomass data found
No TZ PineNeedles Biomass data found
0 photos found
16 sets found
No data found for TZ_Fenergy.
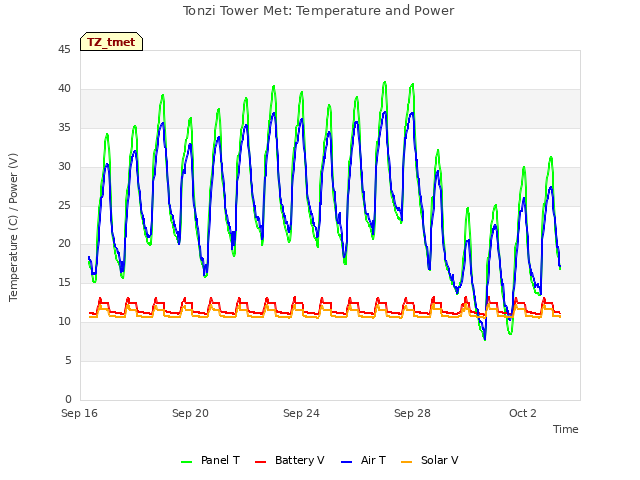
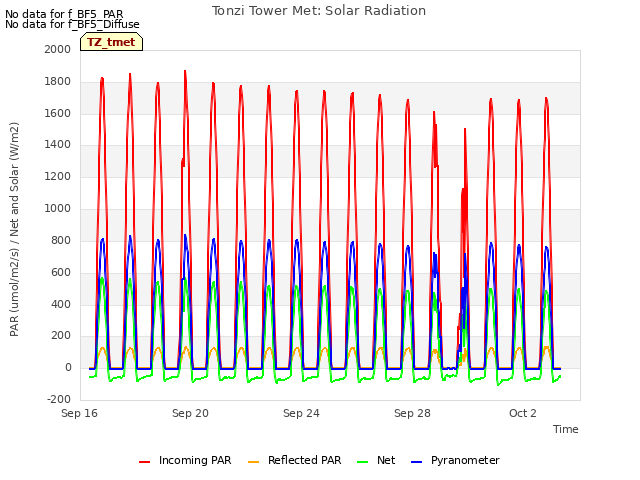
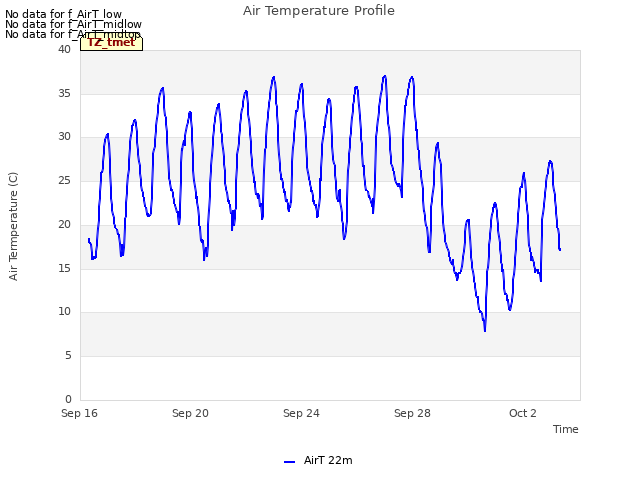
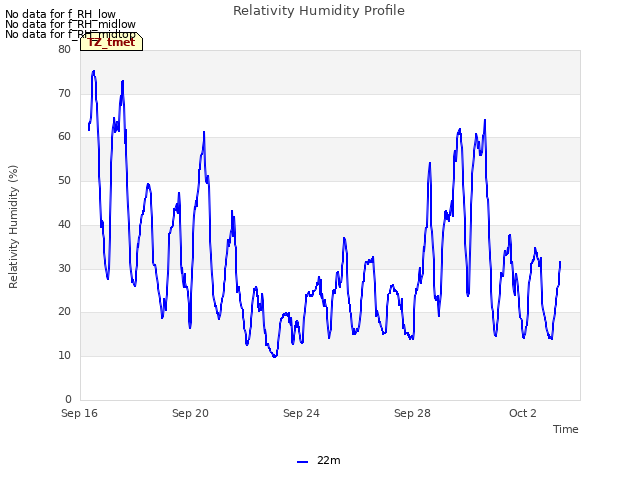
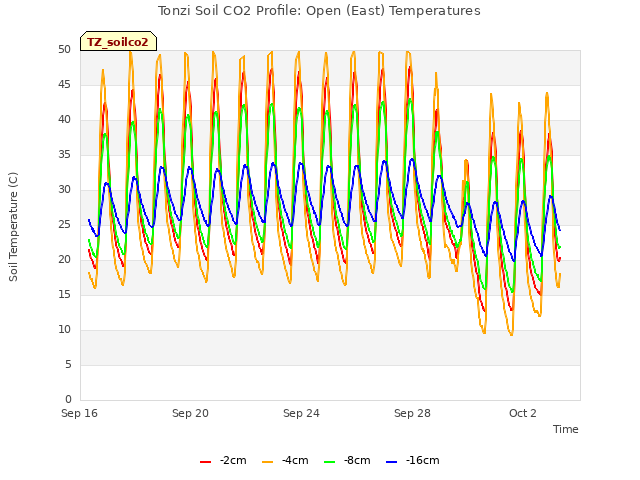
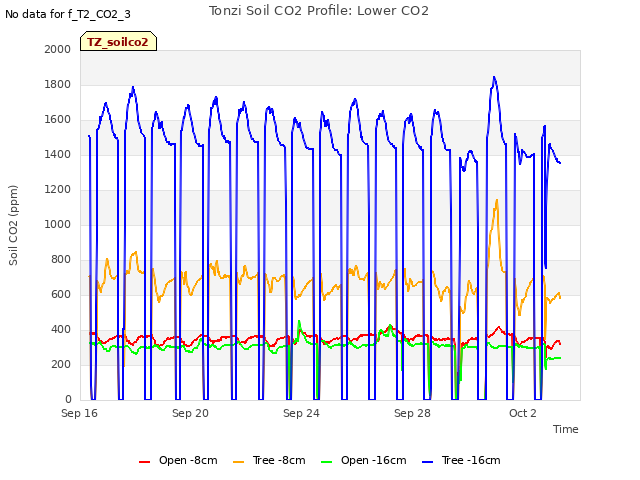
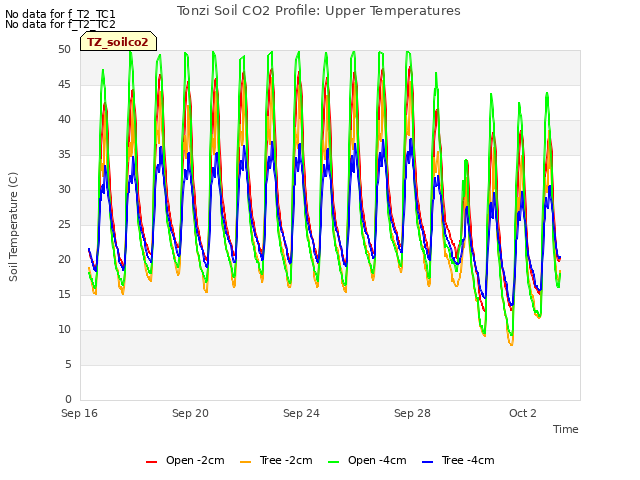
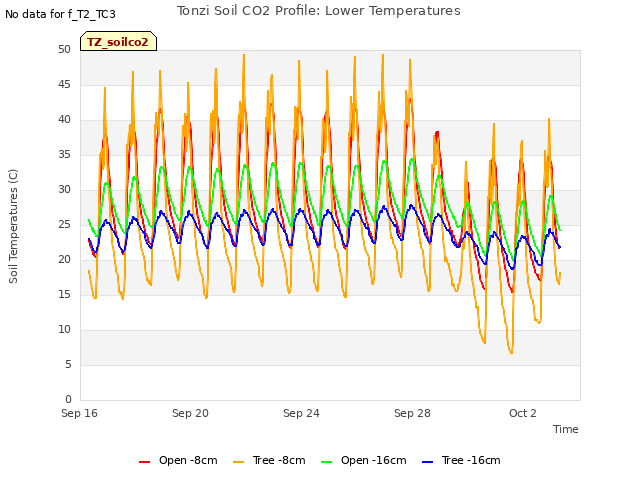
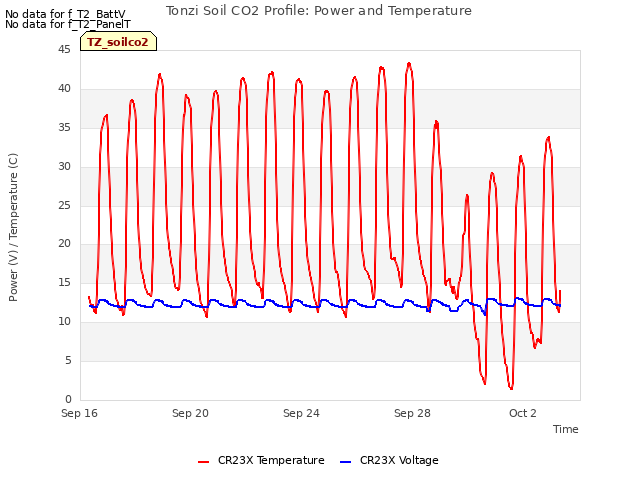
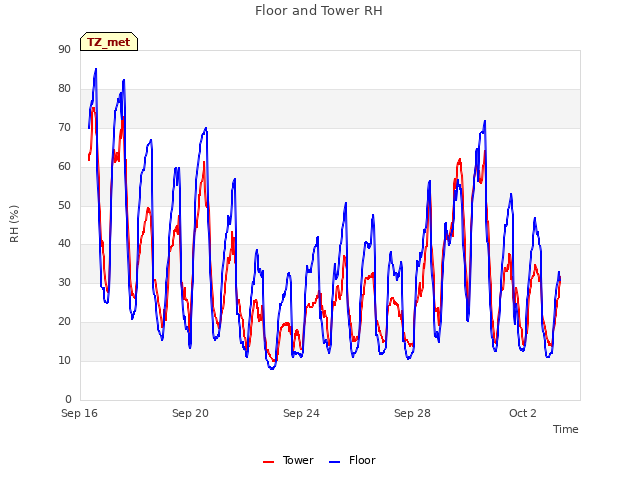
11 TZ_tmet graphs found


11 TZ_soilco2 graphs found


Can't check TZ_mixed
3 TZ_mixed graphs found

No data found for TZ_fflux.
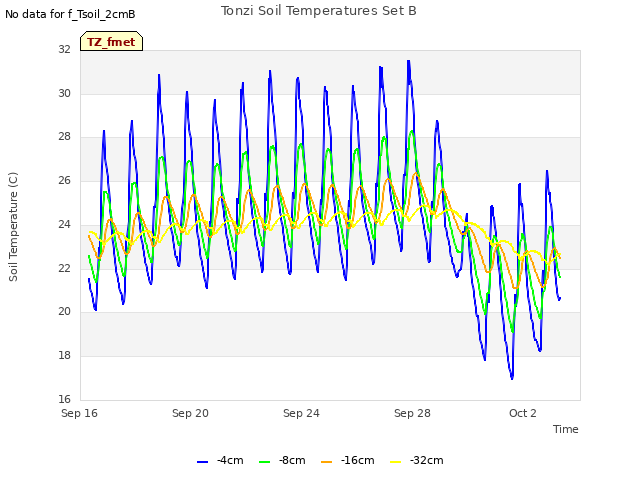
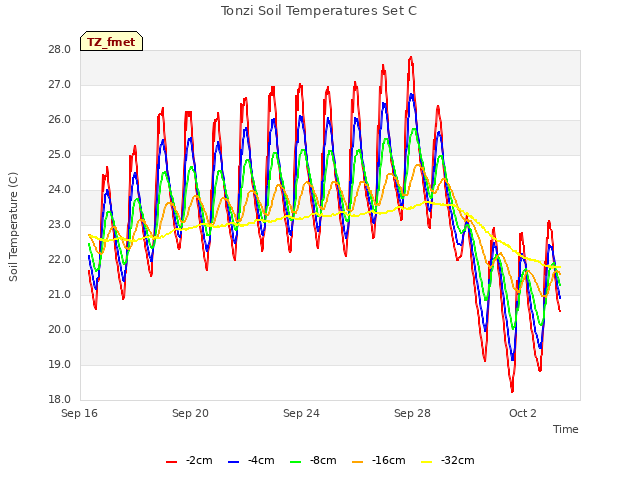
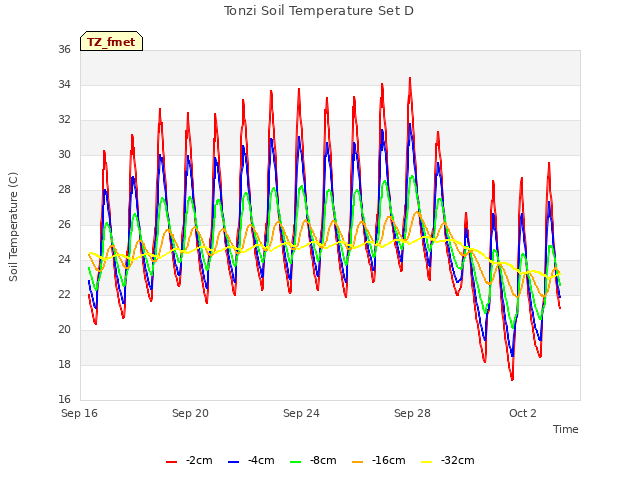
8 TZ_fmet graphs found


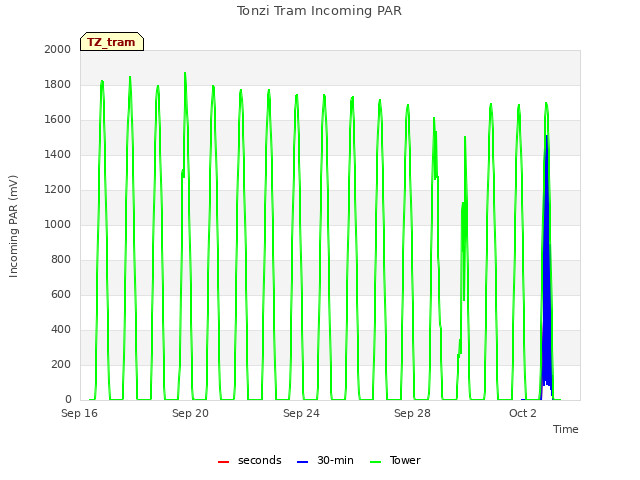
1 TZ_tram graphs found
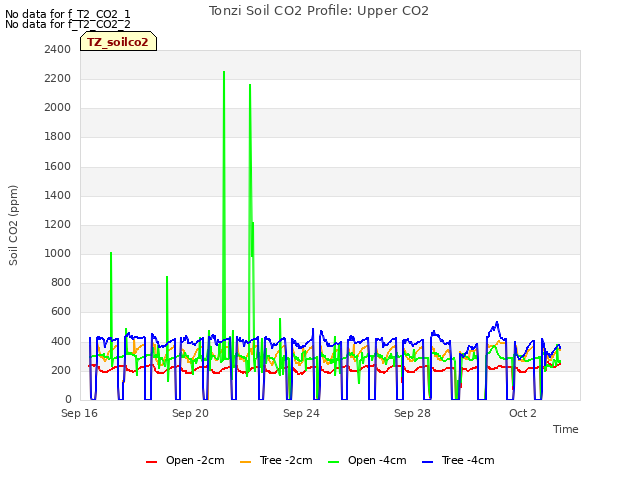
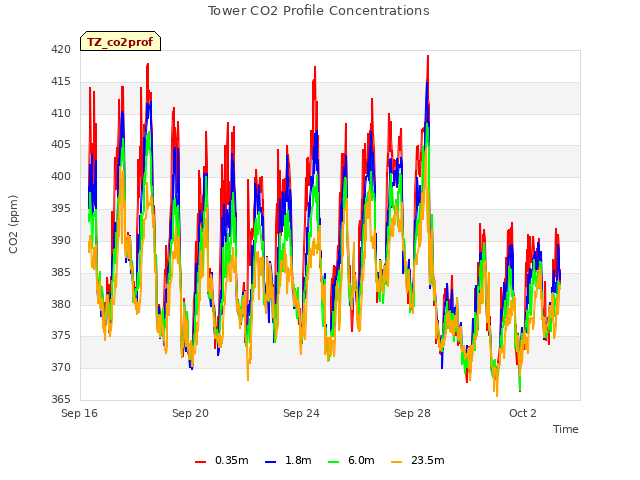
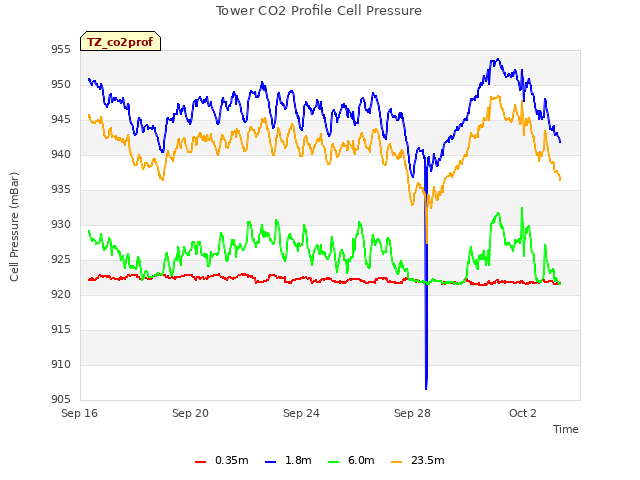
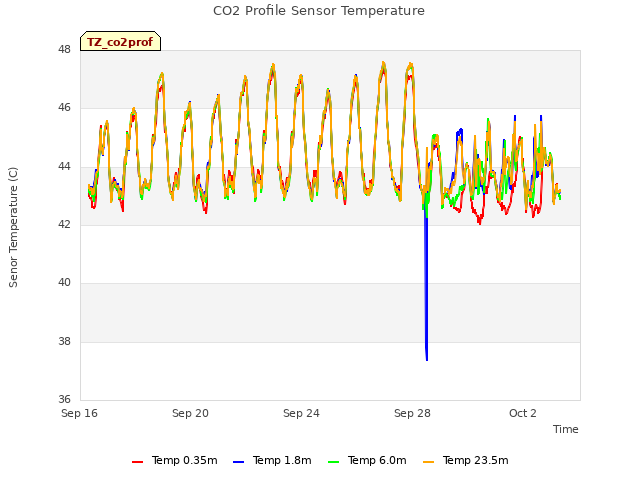
3 TZ_co2prof graphs found
No data found for TZ_irt.
No data found for TZ_windprof.
No data found for TZ_tflux.
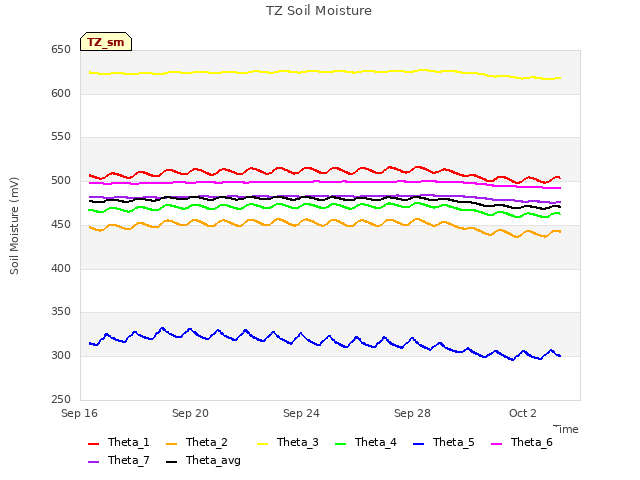
2 TZ_sm graphs found

Can't check TZ_met
1 TZ_met graphs found
Can't check TZVR_mixed
No data found for TZ_osu.
No data found for TZ_fd.
Tonzi Z-cam data


