
Field Notes
<--2012-02-16 11:30:00 | 2012-03-19 12:00:00-->Phenocam link: Searching...
Tonzi: 2012-03-02 11:00:00 (DOY 62)
Author: Siyan Ma
Others: Sonia, Matthias
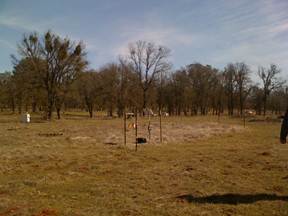
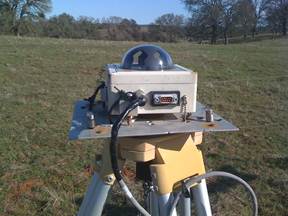
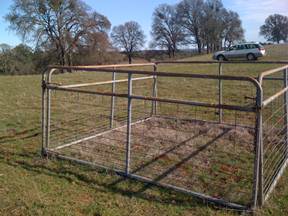
Summary: Sonia and Matthias choose location for LIDAR, cows in Viara cow fence, diffuse radiations stablized, 3rd soil co2 profile installed at Tonzi.
|
When: Date: 3/2/2012 , Day: 62
, Watch Time: 11:00 am .
Where: Tonzi/Vaira Ranch Who: Siyan, Sonia, and Matthias Weather: clear, sunny Phenology: grasses looked greener; lots of dry litters in fenced areas; no oak leaves yet
Summary
Vaira_Grass Site
Cows went into the inside of the fence at Vaira. Fence seems working. Diffusion radiation sensor needs to be stabilized and leveled. See the photos. Matthias and Sonia helped to fix it temporarily in the field.
Tonzi_Tower Site
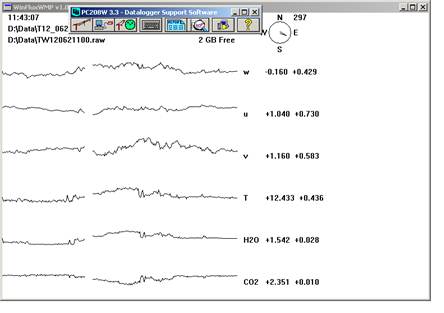
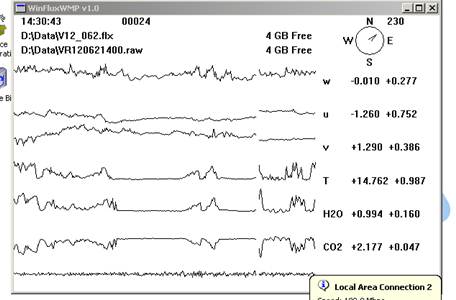
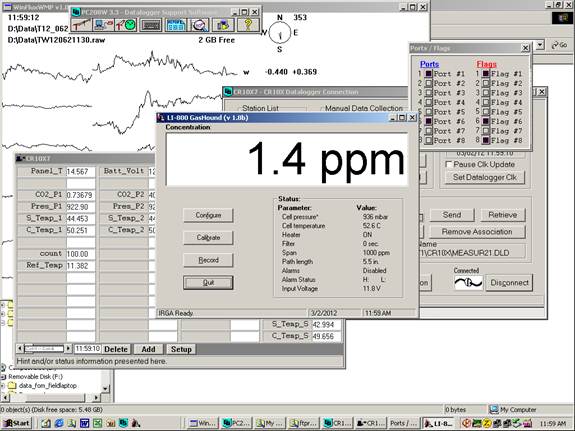
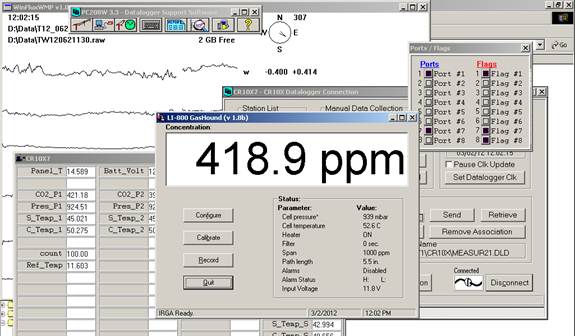
CO2 1600 psig; flow 20 psi; 421.63 ppm. N2 2100 psig; flow 20 psi. Manually calibrate Li-800. Following Ted’s instruction: H:IoneSavanna_2004Tower_2004CO2ProfileLI800_Calibration_Procedure_2Nov04.txt Is the pump running YES, but paused once in a while 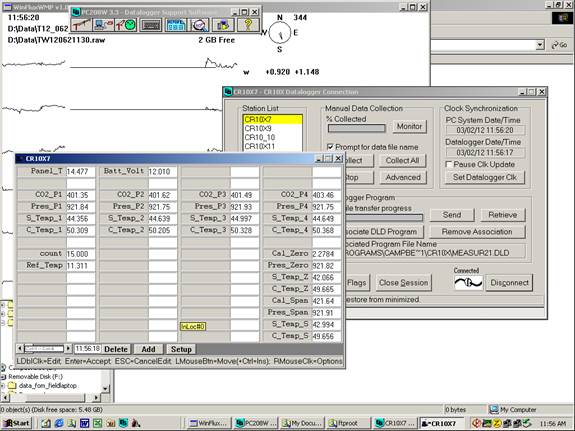
Toniz_Floor Site
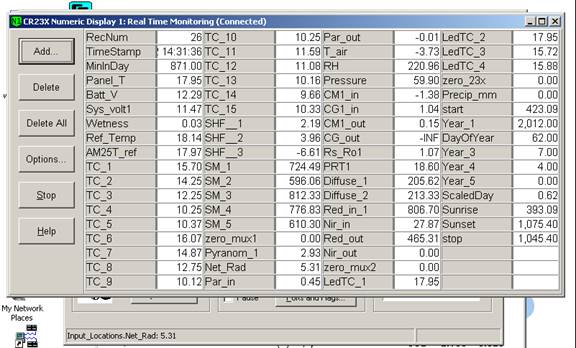
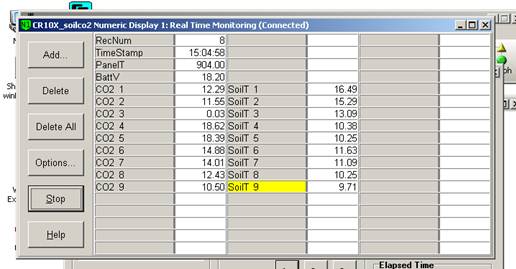
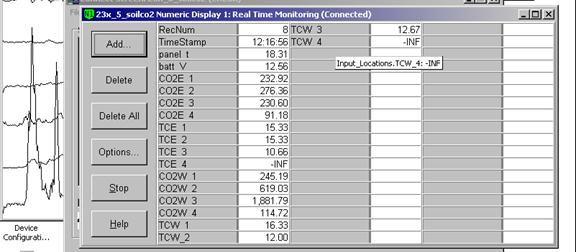
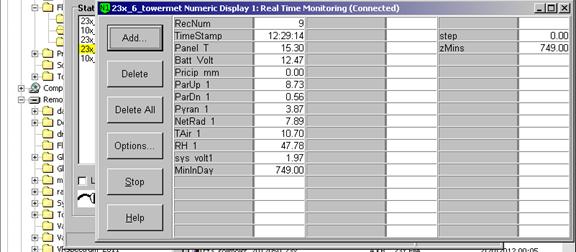
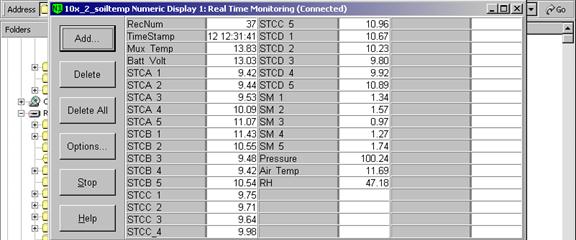
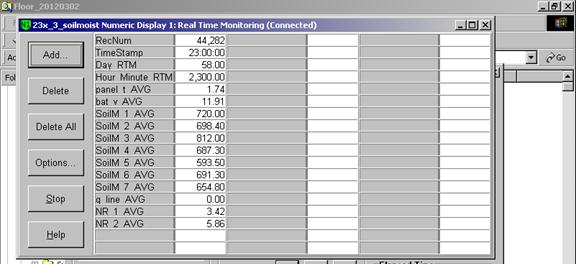
CR23X3 – floor-Met CR10X2 – floor-Met CR23X6 – tower-Met CR23X5 – soil CO2 profile CR10X17-sapflow 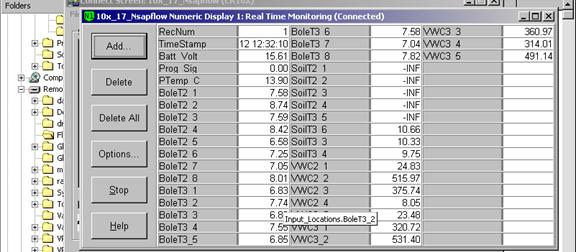
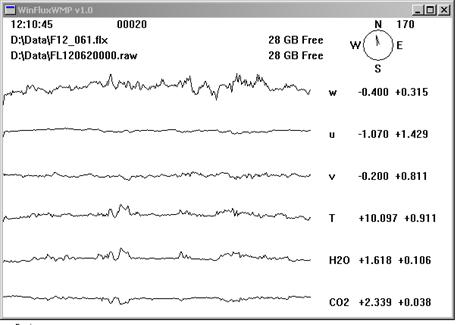
Reading from datalogger Reading from panels of analyzers
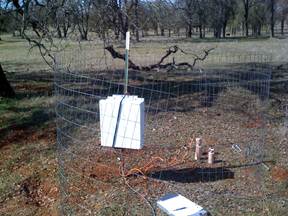
The third set of soil CO2 profile system – Tree2: installed near Liukang’s tree at Tonzi site on Feb. 23, 2012. The set includes one enclosure, 1 CR10X datalogger, 3 transmitters, 3 Vaisala CO2 probes, and 3 thermal couples (see the photo above). The wire for 24v was connected to the power regulator in the enclosure under the tree; the other wire was connected to the battery of the fence for 12v. Vaisala CO2 probes installed at the “Tree2” site: %probe1, 2cm, SN# X1920001, 0...1%, intercept1, -.3381, slope1, 0.19982 %probe2, 4cm, SN# Y2009109,0...1%intercept2,44.5972,slope2,0.19478 %probe3, 8cm, SN# F4960019, 0…3%,intercept3,22.2534,slope3,0.06658
Dendrometers
Notes: “X” means not working any more. Dendrometers installed by Gretchen group
| ||||||||||||||||||||||||||||||||||||||||||||||||||||||||||||||||||||||||||||||||||||||||||||||||||||||||||||||||||||||||||||||||||||||||||||||||||||||||||||||||||||||||||||||||||||||||||||||||||||||||||||||||||||||||||||||||||||||||||||||||||||||||||||||||||||||||||||||||||||||||||||||||||||||||||||||||||||||||||||||||||||||||||||||||||||||||||||||||||||||||||||||||||||||
Field Data
No tank data
Well Depth
| Date | Location | Depth (feet) |
|---|---|---|
| 2012-03-02 | TZ_floor | 29.7 |
| 2012-03-02 | TZ_road | 37.8 |
| 2012-03-02 | TZ_tower | 34.35 |
No TZ Moisture Point data found
No VR Moisture Point data found
No TZ grass heigth found
No VR grass heigth found
Tree DBH
| Date | Tag# | Reading (mm) |
|---|---|---|
| 2012-03-02 | 102 | 9.5 |
| 2012-03-02 | 245 | 20.9 |
| 2012-03-02 | 4 | 19.7 |
| 2012-03-02 | 7 | 15.4 |
| 2012-03-02 | 72 | 8.6 |
| 2012-03-02 | 79 | 7.1 |
| 2012-03-02 | 8 | 6.9 |
No water potential data found
No TZ Grass Biomass data found
No TZ OakLeaves Biomass data found
No TZ PineNeedles Biomass data found
1 photos found
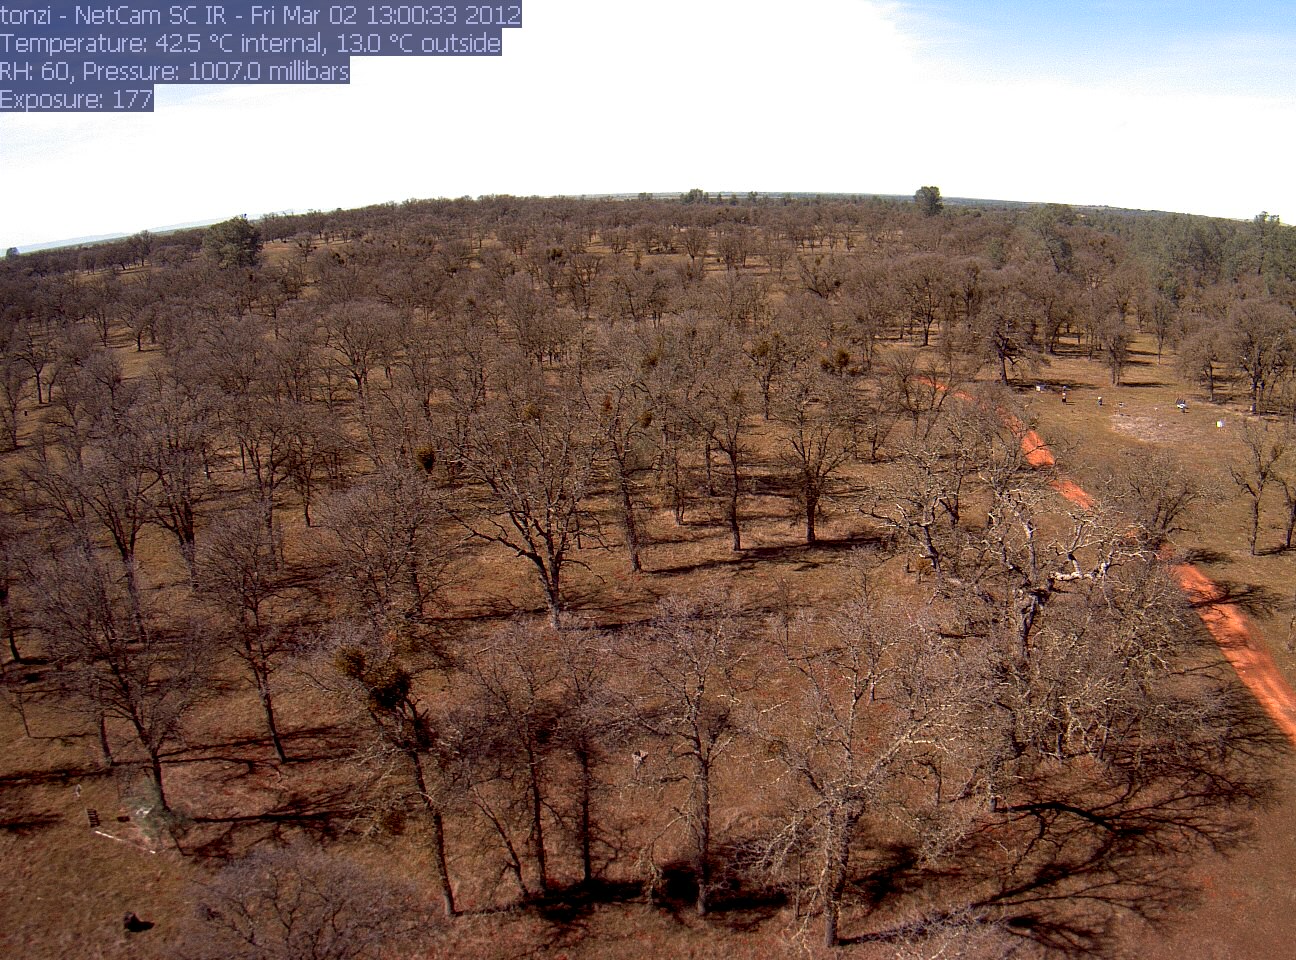
tonzi_2012_03_02_130101.jpg ( 2012-03-02 13:00:30 ) Full size: 1296x960
Fieldwork near Jessicas (liukangs) tree
16 sets found
No data found for TZ_Fenergy.
11 TZ_tmet graphs found
11 TZ_soilco2 graphs found
Can't check TZ_mixed
3 TZ_mixed graphs found
1 TZ_fflux graphs found
8 TZ_fmet graphs found
1 TZ_tram graphs found
3 TZ_co2prof graphs found
No data found for TZ_irt.
No data found for TZ_windprof.
1 TZ_tflux graphs found
2 TZ_sm graphs found
Can't check TZ_met
1 TZ_met graphs found
Can't check TZVR_mixed
8 TZ_osu graphs found
No data found for TZ_fd.
Tonzi Z-cam data