rice field banner biometlab logo


Field Notes

<--2009-04-17 05:10:00 | 2009-05-07 05:00:00-->

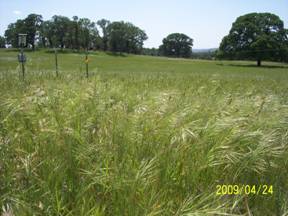
Tonzi: 2009-04-24 09:00:00 (DOY 114)
Author: Siyan Ma
Others: Gretchen


When: Date: 4/24/2009 , Day: 114 , Watch Time: 9:00am .
Where: Tonzi/Vaira Ranch
Who: Siyan, Gretchen
Weather: a little bit rain in the early morning, then cloudy, then sunshine
Phenology: yellow, purple flowers at Tonzi, yellow, purple, white flowers at Vaira


Summary:
  1. swapped Li-7500 at Tower and Floor
  2. swapped CR23X datalogger for Tower met (tz6)
  3. checked and downloaded data at Tower, Floor, and Vaira
  4. Calibrated Li-800 in the field (bring the copy of Ted’s instruction).
  5. took spectrometer measurement
  6. camera
  7. Link to screen copies from Tower PC
  8. Link to screen copies from Floor PC
  9. Link to screen copies from Vaira PC

Vaira_Grass Site
  1. Fence and gate power: 12 v.
  2. Panel and Batteries: - v; - amps; - amps.
  3. Reading from Gillsonic screen before downloading data. (The value of H2O and CO2 should be in the range of 0 – 5 v.)

  1. downloading data YES!
  2. Check the fans of air temp. and relative humidity sensors at Vaira. YES!
  3. Check MD-9 system connections YES!
  4. Check CR23X with two multiplexers YES!
  5. Check levels of Radiation sensors, clear up surfaces.

  1. Check rain gage, make sure not clogged. YES!
  2. Closed gate and set up fence. YES!

Tonzi_Tower Site

  1. Fence and gate power: 12 v.
  2. Panel and Batteries: 12.9 v; 0.0 amps; 5.9 amps.
  3. Reading from Gillsonic screen before downloading data. (The value of H2O and CO2 should be in the range of 0 – 5 v.)

  1. downloading data YES!
  2. swaping Li-7500 Analyzer. (Remove SN# 418 ; install SN# 976 )
  3. check the fans of air temp. and relative humidity sensors on the tower and the floor. YES!
  4. Check rain gage, make sure not clogged. YES!
  5. Check calibration cylinders; YES!

CO2 1500 psig; flow 20 psi.
N2 1000 psig; flow 20 psi.
Manually calibrate Li-800. Following Ted’s instruction: H:\IoneSavanna_2004\Tower_2004\CO2Profile\LI800_Calibration_Procedure_2Nov04.txt
Is the pump running‌ YES!
How to check the CO2 values‌ Click “Ports/Flags” button to see which ports or flags is setting high. Pressure should be less than ambient value. When Flag 8 is high, it may indicate that RRR’s battery is low.
  1. close gate and set up fence. YES!


Toniz_Floor Site
See wrong message
  1. Fence and gate power: 12 v.
  2. Panel and Batteries: 12.6 v; 4.2 amps; 3.8 amps.
  3. Reading from Gillsonic screen before downloading data. (The value of H2O and CO2 should be in the range of 0 – 5 v.)

  1. downloading data YES!
  2. swaping Li-7500 Analyzer. (Remove SN# 35 ; install SN# 73 )

  1. Check MD-9 system connections YES!

CR23X3 – floor-Met
CR23X5 – soil CO2 profile
CR23X6 – tower-Met
CR10X2 – floor-Met
CR10X4 – sap-flow
CR10X7 – CO2 profile
CR10X8 – wind profile
  1. Soil CO2 profile

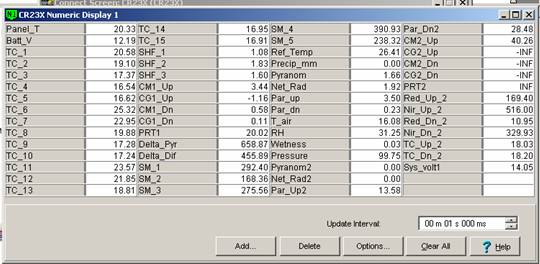
Reading from datalogger
  1. Close gate and set up fence. YES!


Field Data

No tank data

Well Depth

DateLocationDepth (feet)
2009-04-24TZ_floor25.94
2009-04-24TZ_road34.53
2009-04-24TZ_tower29.71

No TZ Moisture Point data found

No VR Moisture Point data found

No TZ grass heigth found

No VR grass heigth found

Tree DBH

DateTag#Reading (mm)
2009-04-24111.6
2009-04-241029.1
2009-04-2429.2
2009-04-242456.8
2009-04-2425015.9
2009-04-24312.8
2009-04-2444.1
2009-04-24510.8
2009-04-2466.1
2009-04-24711.9
2009-04-24726.4
2009-04-247918.6
2009-04-24813.5

No water potential data found

No TZ Grass Biomass data found

No TZ OakLeaves Biomass data found

No TZ PineNeedles Biomass data found

0 photos found

Graphs display:
16 sets found

No data found for TZ_Fenergy.
11 TZ_tmet graphs found

Tonzi Tower Met: Temperature and Power

Tonzi Tower Met: Solar Radiation

Tonzi Tower Met: IRT Sensors

LED Sensor Incoming

LED Sensor Outgoing

4-Band Solar Radiation

Air Temperature Profile

Relativity Humidity Profile

Tonzi Tower PRI

SRS PRI/NDVI

SRS NDVI

11 TZ_soilco2 graphs found

Tonzi Soil CO2 Profile: Open (East) CO2

Tonzi Soil CO2 Profile: Tree (West) CO2

Tonzi Soil CO2 Profile: Open (East) Temperatures

Tonzi Soil CO2 Profile: Tree (West) Temperatures

Tonzi Soil CO2 Profile: Upper CO2

Tonzi Soil CO2 Profile: Lower CO2

Tonzi Soil CO2 Profile: Upper Temperatures

Tonzi Soil CO2 Profile: Lower Temperatures

Tonzi Soil CO2 Profile: Power and Temperature

Tree 2 Soil CO2

Tree 2 Soil Temperature

Can't check TZ_mixed
3 TZ_mixed graphs found

Tonzi PPT

Tonzi CO2 and H2O Densities

Air Pressure

No data found for TZ_fflux.
8 TZ_fmet graphs found

Soil Heat Flux

Tonzi Soil Temperature Set A

Tonzi Soil Temperatures Set B

Tonzi Soil Temperatures Set C

Tonzi Soil Temperature Set D

Well Level

Well Water Temperature

Soil Water Potential

No data found for TZ_tram.
3 TZ_co2prof graphs found

Tower CO2 Profile Concentrations

Tower CO2 Profile Cell Pressure

CO2 Profile Sensor Temperature

No data found for TZ_irt.
No data found for TZ_windprof.
No data found for TZ_tflux.
2 TZ_sm graphs found

Floor Solar Radiations

TZ Soil Moisture

Can't check TZ_met
1 TZ_met graphs found

Floor and Tower RH

Can't check TZVR_mixed
No data found for TZ_osu.
No data found for TZ_fd.
Tonzi Z-cam data

plot of Tonzi z-cam LAI

plot of Tonzi z-cam gap fration


Login
Select Notes:

This material is based upon work supported by the National Science Foundation and US Department of Energy. Any opinions, findings, conclusions, or recommendations expressed in the material are those of the author(s) and do not necessarily reflect the views of the supporters.