Field Notes
<--2009-04-03 05:30:00 |
2009-04-24 09:00:00-->
Phenocam link:
Searching...Tonzi: 2009-04-17 05:10:00 (DOY 107)
Author: Siyan Ma
Others: Joe
When: Date: 4/17/2009 , Day: 107
, Watch Time: 5:10am .
Where: Tonzi/Vaira Ranch
Who: Siyan, Joe
Weather:
clear, sunshine
Phenology:
white and yellow flowers at Vaira, yellow and purple flowers at Tonzi, grass
stems out, oak leaves still expanding
Summary
- took Pre-dawn leaf water
potential measurements
- measured A-Ci and A-PAR
curves for oak and gray pine
- checked and download data at
Tower, Floor, and Vaira. Three
systems are working fine.
- Calibrated Li-800 in the
field (bring the copy of Ted’s instruction).
- Collected grass sample for
LAI and phenology in Tower and Vaira, oak branches
- read dendrometers
- measured soil moisture probes
- took spectrometer measurement
at Vaira and Tonzi
- camera: field pictures
Vaira_Grass
Site
- Fence and gate power: 12
v.
- Panel and Batteries: v; amps; amps.
- Reading from Gillsonic screen
before downloading data. (The value
of H2O and CO2 should be in the range of 0 – 5 v.)
Time
|
|
Path/File name
|
D:\Data\V09_ 107 .flx
D:\Data\VR09 .raw
|
|
mean
|
std
|
|
mean
|
std
|
w
|
-0.23
|
0.302
|
Ts
|
21.6
|
0.93
|
u
|
0.08
|
0.653
|
H2O
|
2.149
|
0.211
|
v
|
-1.0
|
1.457
|
CO2
|
1.741
|
0.06
|
|
|
|
Spiky! Tc
|
2.127
|
0.148
|
- downloading data YES!
- Check the fans of air temp.
and relative humidity sensors at Vaira. YES!
- Check MD-9 system connections YES!
- Check CR23X with two
multiplexers YES!
Sys_vot = 13.4
- Check levels of Radiation
sensors, clear up surfaces. YES!
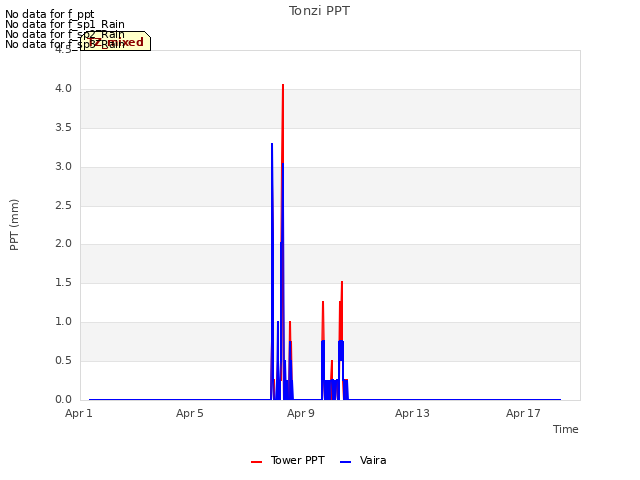
- Check rain gage, make sure
not clogged. YES!
- Closed gate and set up fence.
YES!
Tonzi_Tower Site
- Fence and gate power: 12
v.
- Panel and Batteries: 12.2 v; 0.0 amps; 6.2 amps.
- Reading from Gillsonic screen
before downloading data. (The value
of H2O and CO2 should be in the range of 0 – 5 v.)
Time
|
|
Path/File name
|
D:\Data\T09_ 107 .flx
D:\Data\TW09 .raw
|
|
mean
|
std
|
|
mean
|
std
|
w
|
-0.01
|
0.134
|
Ts
|
14.6
|
0.689
|
u
|
-0.33
|
0.315
|
H2O
|
1.95
|
0.019
|
v
|
0.26
|
0.873
|
CO2
|
2.106
|
0.02
|
- downloading data YES!
- check the fans of air temp.
and relative humidity sensors on the tower and the floor. YES!
- Check rain gage, make sure
not clogged. YES!
- Check calibration cylinders; YES!
CO 2 1500 psig; flow 21
psi.
N 2 1000
psig; flow 20 psi.
Manually calibrate Li-800. Following Ted’s instruction: H:\IoneSavanna_2004\Tower_2004\CO2Profile\LI800_Calibration_Procedure_2Nov04.txt
Is the pump running YES!
1
|
2
|
3
|
4
|
zero
|
span
|
395
|
398
|
398
|
401
|
0.937
|
429
|
953
|
950
|
947
|
946
|
955
|
955
|
45
|
45
|
45
|
45
|
43
|
43
|
51
|
51
|
51
|
51
|
50
|
50
|
- close gate and set up fence. YES!
Toniz_Floor
Site
- Fence and gate power: 12
v.
- Panel and Batteries: v; amps; amps.
- Reading from Gillsonic screen
before downloading data. (The value
of H2O and CO2 should be in the range of 0 – 5 v.)
Time
|
|
Path/File name
|
D:\Data\F09_ 107 .flx
D:\Data\FL09 .raw
|
|
mean
|
std
|
|
mean
|
std
|
w
|
-0.46
|
0.208
|
Ts
|
13.12
|
0.483
|
u
|
-0.96
|
1.113
|
H2O
|
2.6
|
0.084
|
v
|
0.59
|
0.309
|
CO2
|
1.9
|
0.026
|
- downloading data YES!
- Check MD-9 system connections
Something wrong
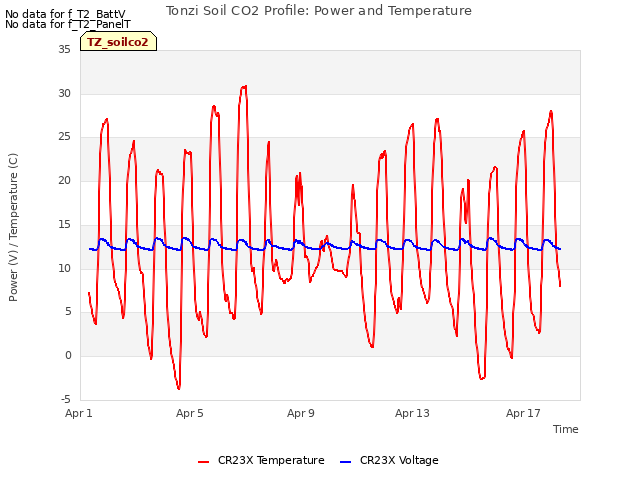
CR23X3 – floor-Met
CR23X5 – soil CO 2
profile
CR23X6 – tower-Met
CR10X2 – floor-Met
CR10X4 – sap-flow
CR10X7 – CO 2 profile
CR10X8 – wind profile
- Soil CO2 profile YES!
Reading
from datalogger
Panel
temp
|
11.3
|
|
|
Battery
voltage
|
12.5
|
|
|
CO2E_1
|
620
|
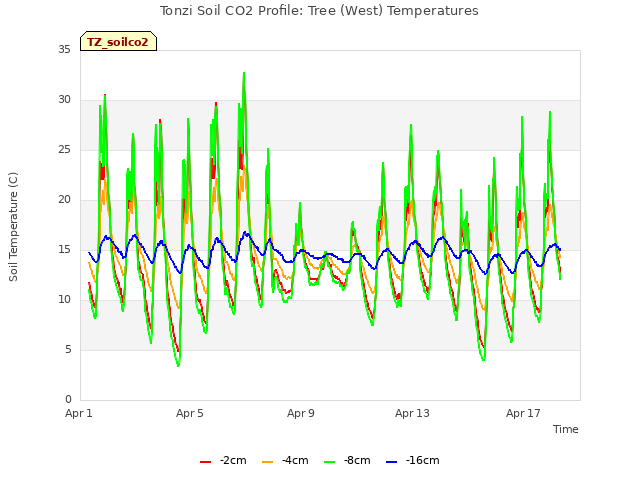
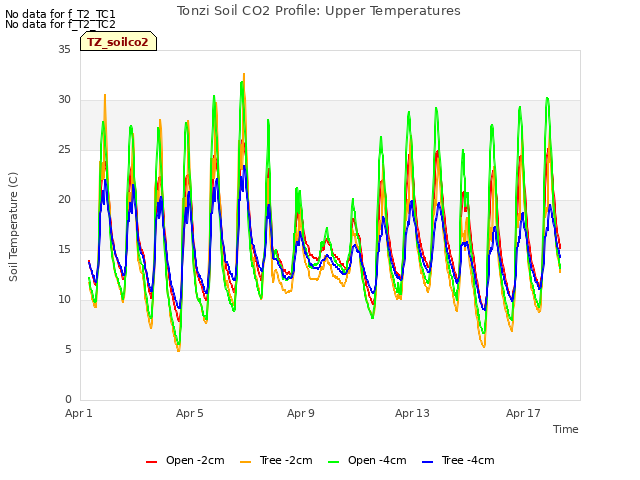
TCE_1
|
13.1
|
CO2W_1
|
906
|
TCW_1
|
12.6
|
CO2E_2
|
780
|
TCE_2
|
13.5
|
CO2W_2
|
1116
|
TCW_2
|
12.6
|
CO2E_3
|
1842
|
TCE_3
|
12.5
|
CO2W_3
|
1764
|
TCW_3
|
13.3
|
CO2E_4
|
1882
|
TCE_4
|
13.5
|
CO2W_4
|
2336
|
TCW_4
|
13.3
|
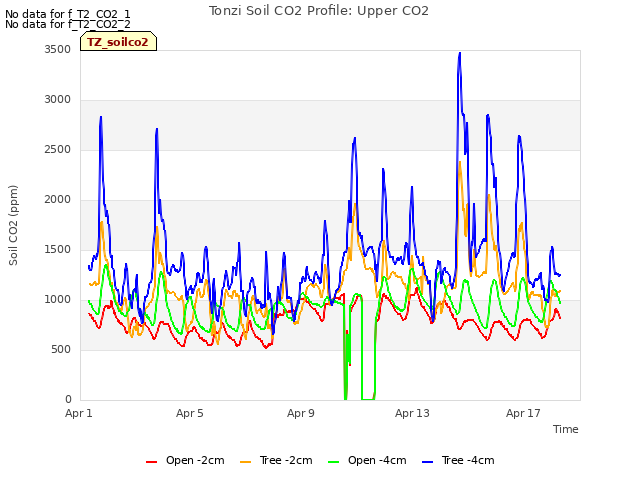
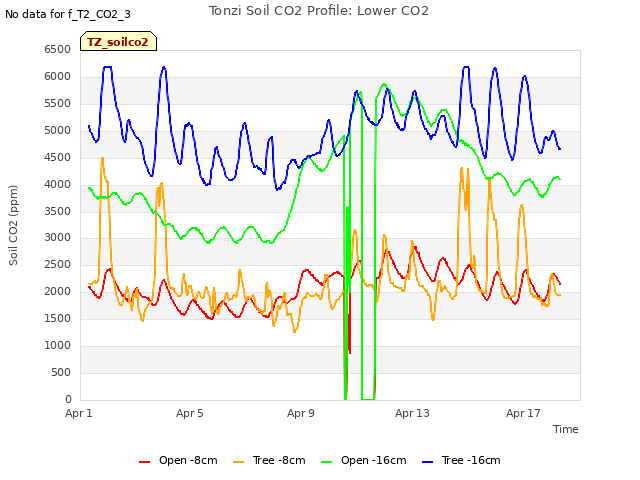
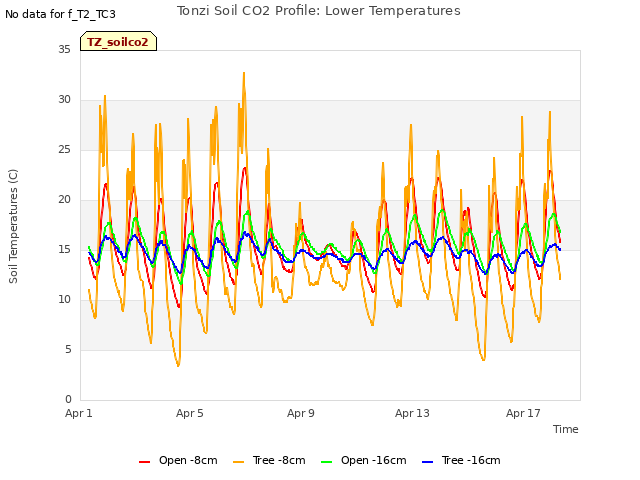
Reading
from panels of analyzers
depth
|
Open
|
order
|
depth
|
Tree
|
order
|
2cm
(1%)
|
1250
|
1
|
2cm
(1%)
|
1820
|
1
|
4cm
|
1580
|
2
|
4cm
|
2260
|
4
|
8cm
|
3740
|
3
|
8cm
|
3570
|
2
|
16cm
|
7600
|
4
|
16cm
|
9470
|
3
|
- Close gate and set up fence. YES!
Tonzi
|
|
|
|
Dendrometer
|
|
|
|
|
|
|
Date
|
Day
|
Tag #
|
Reading (mm)
|
4/17/2009
|
107
|
71
|
X
|
|
|
72
|
6.0 (reset)
|
|
|
77
|
X
|
|
|
78
|
X
|
|
|
79
|
13.6
|
|
|
245
|
6.9
|
|
|
248
|
X
|
|
|
250
|
16.5
|
|
|
255
|
X
|
|
|
252
|
X
|
|
|
102
|
9.4
|
Notes:
“X” means not working any more.
Dendrometers
installed by Gretchen group
Date
|
Day
|
Tag #
|
Reading (mm)
|
Original reading (mm)
|
Location
|
|
|
1
|
11.6
|
|
133
|
|
|
2
|
13.0
|
|
11828
|
|
|
3
|
9.4
|
|
11829
|
|
|
4
|
4.2
|
|
|
|
|
5
|
4.2
|
|
|
|
|
6
|
X
|
|
|
|
|
7
|
11.9
|
|
|
|
|
8
|
13.6
|
|
broken
|
|
|
|
|
|
|
tonzi
|
7931AFE
|
402165
|
574B4B
|
402FF3
|
574632
|
7A432E
|
7A3C6E
|
7A3B40
|
7A4AAA
|
4/17/2009
|
107
|
|
|
|
|
|
|
|
|
|
SM
|
|
|
|
|
|
|
|
|
0-15
|
26.7
|
10.0
|
28.2
|
15.3
|
20.3
|
21.7
|
20.0
|
19.1
|
11.8
|
15-30
|
30.4
|
26.8
|
31.9
|
28.9
|
22.8
|
17.9
|
23.1
|
26.1
|
14.5
|
30-45
|
33.8
|
35.7
|
37.4
|
33.5
|
35.4
|
21.5
|
21.2
|
27.6
|
28.2
|
45-60
|
38.0
|
52.9
|
60.9
|
46.6
|
40.0
|
26.2
|
31.9
|
44.0
|
22.5
|
|
|
|
|
|
|
|
|
|
|
|
A6D882B
|
A3D04E8
|
A6D72F5
|
|
|
|
|
|
|
|
|
|
|
|
|
|
|
|
|
0-15
|
25.8
|
20.9
|
12.1
|
|
|
|
|
|
|
15-30
|
19.1
|
19.7
|
22.8
|
|
|
|
|
|
|
30-45
|
27.9
|
25.7
|
25.7
|
|
|
|
|
|
|
45-60
|
37.4
|
43.4
|
45.7
|
|
|
|
|
|
|
|
|
|
|
|
|
|
|
|
|
vaira
|
57318a
|
7933dee
|
|
|
|
|
|
|
|
0-15
|
12.2
|
10.0
|
|
|
|
|
|
|
|
15-30
|
16.9
|
21.4
|
|
|
|
|
|
|
|
30-45
|
22.9
|
21.5
|
|
|
|
|
|
|
|
45-60
|
23.6
|
19.3
|
|
|
|
|
|
|
|
|
Field Data
No tank data
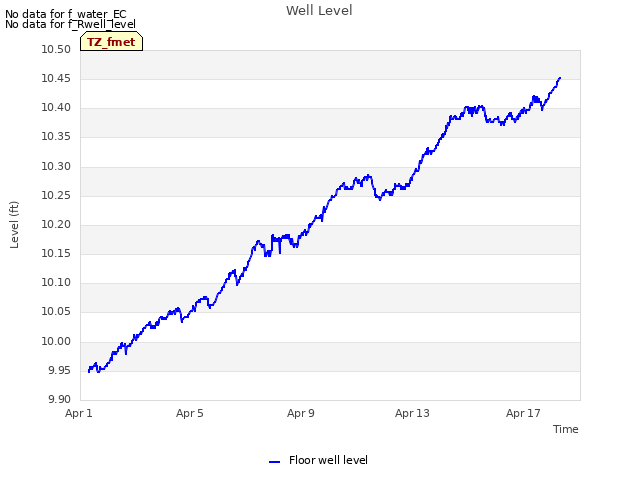
No TZ Well data found
No TZ Moisture Point data found
No VR Moisture Point data found
No TZ grass heigth found
No VR grass heigth found
No TZ Tree DBH found
Water Potential - mode: raw
| Time | Species | Tree | readings (bar) |
|---|
| 2009-04-17 04:52:00 |
PINE |
UNKNOWN |
-5 |
-6.2 |
-4.4 |
-4.8 |
-4.4 |
-3.5 |
-2.4 |
-4.1 |
-6.2 |
-2 |
-8 |
-2.5 |
-4.5 |
| 2009-04-17 05:25:00 |
OAK |
102 |
-4.5 |
|
|
|
|
|
|
|
|
|
|
|
|
| 2009-04-17 05:27:00 |
OAK |
102 |
|
-1.8 |
|
|
|
|
|
|
|
|
|
|
|
| 2009-04-17 05:28:00 |
OAK |
92 |
|
-2.5 |
|
|
|
|
|
|
|
|
|
|
|
| 2009-04-17 05:32:00 |
OAK |
102 |
|
|
-3.9 |
|
|
|
|
|
|
|
|
|
|
| 2009-04-17 05:35:00 |
OAK |
102 |
-3.3 |
|
|
|
|
|
|
|
|
|
|
|
|
| 2009-04-17 05:37:00 |
OAK |
102 |
|
-1.2 |
|
|
|
|
|
|
|
|
|
|
|
| 2009-04-17 05:42:00 |
OAK |
102 |
|
|
-4.4 |
|
|
|
|
|
|
|
|
|
|
| 2009-04-17 05:45:00 |
OAK |
92 |
-3.6 |
|
|
|
|
|
|
|
|
|
|
|
|
| 2009-04-17 05:50:00 |
OAK |
92 |
|
|
-6 |
|
|
|
|
|
|
|
|
|
|
| 2009-04-17 12:04:00 |
OAK |
UNKNOWN |
-1.25 |
-7.2 |
-9.4 |
-9 |
-10.5 |
-10.5 |
-15 |
-13 |
-15 |
|
|
|
|
| 2009-04-17 12:04:00 |
PINE |
UNKNOWN |
-1.25 |
-7.2 |
-9.4 |
-9 |
-10.5 |
-10.5 |
-15 |
-13 |
-15 |
|
|
|
|
No TZ Grass Biomass data found
No TZ OakLeaves Biomass data found
No TZ PineNeedles Biomass data found
0 photos found
16 sets found
No data found for TZ_Fenergy.
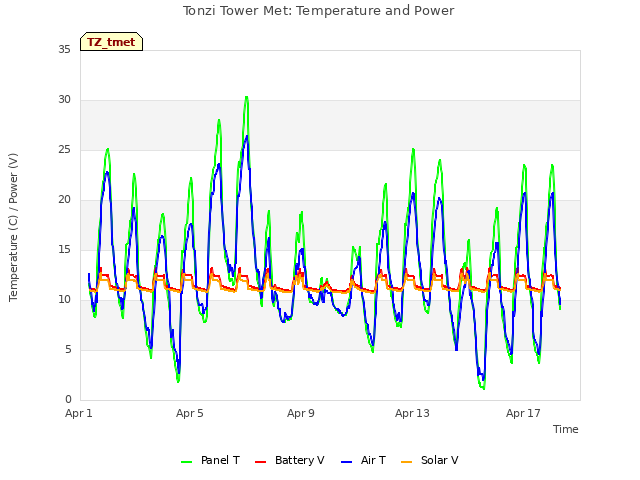
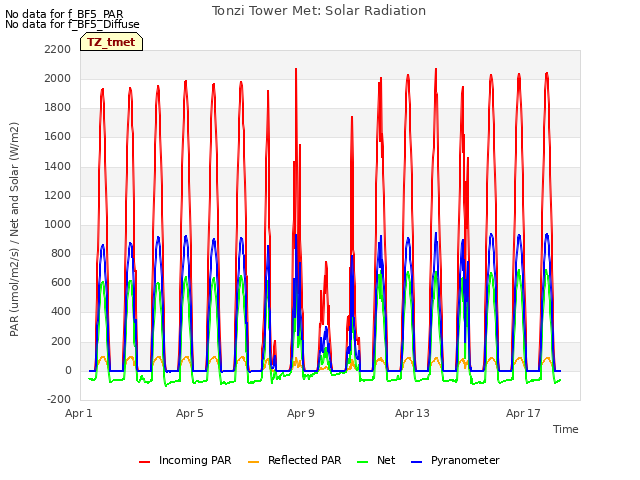
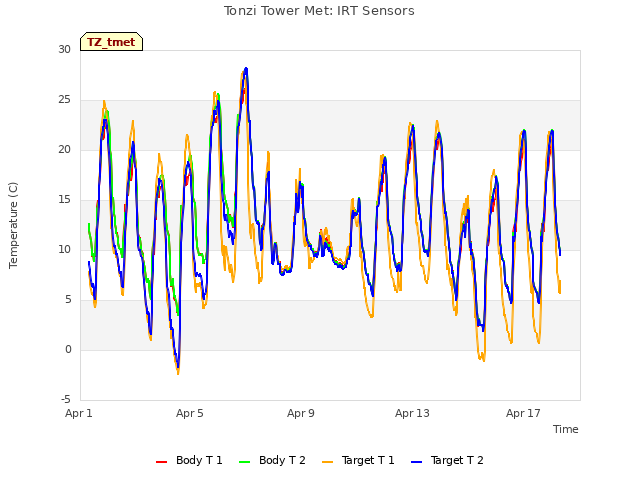
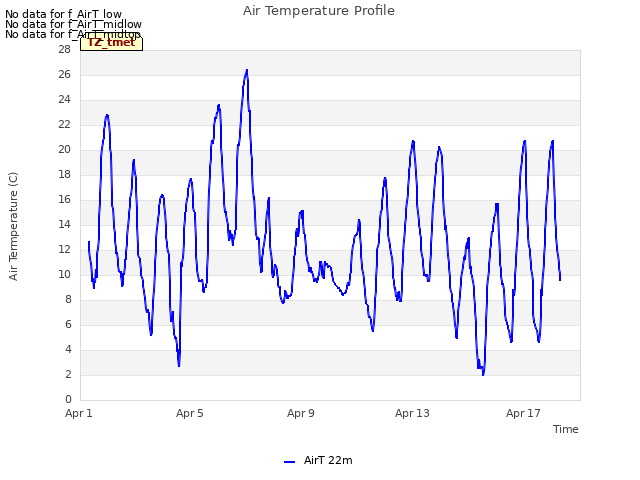
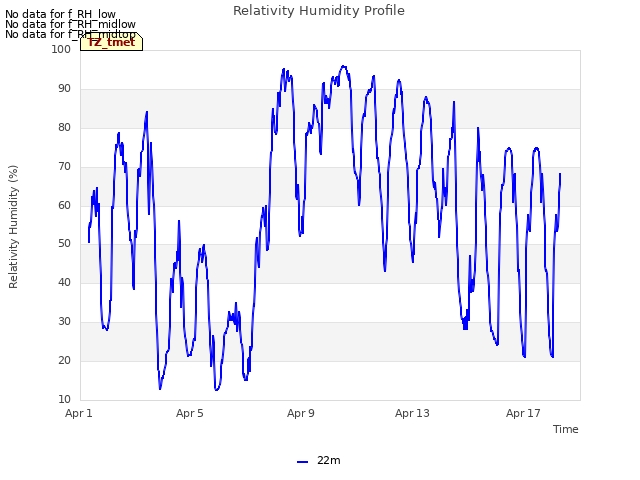
11 TZ_tmet graphs found


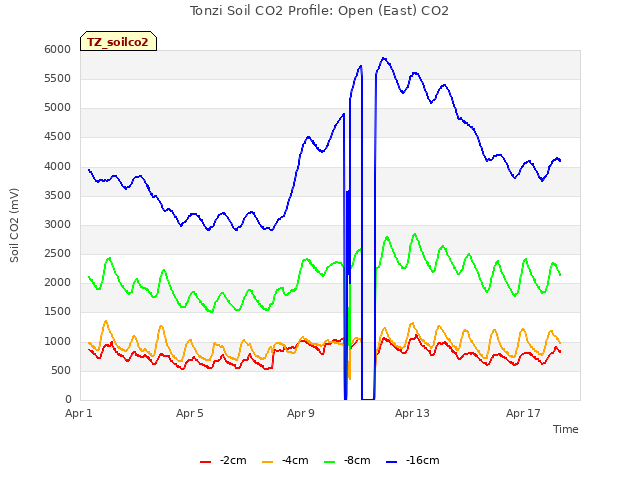
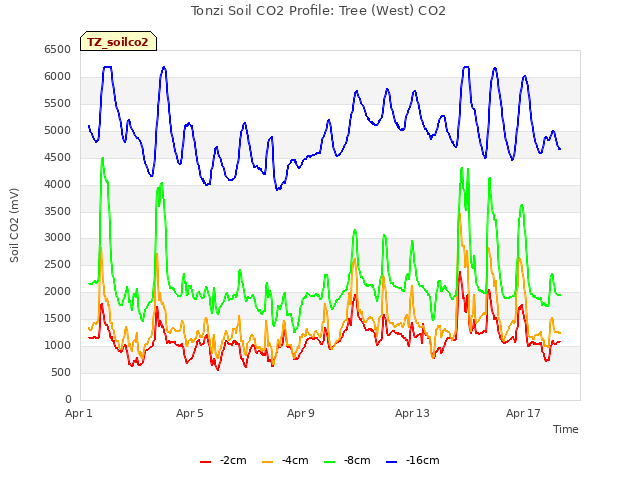
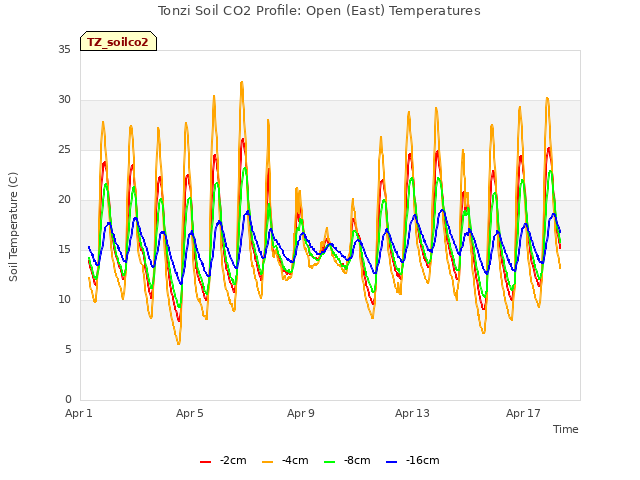
11 TZ_soilco2 graphs found


Can't check TZ_mixed
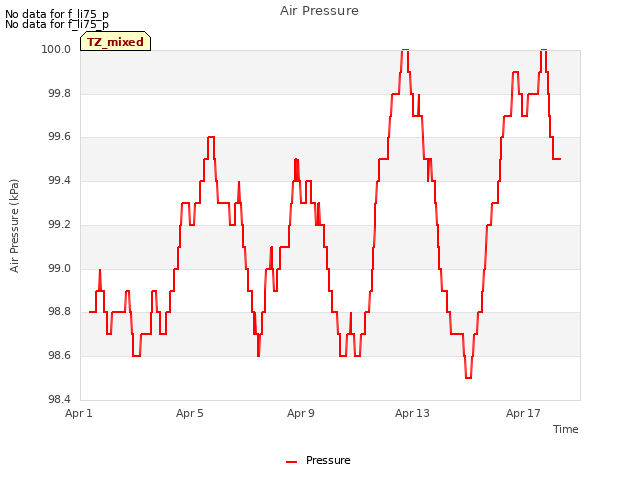
3 TZ_mixed graphs found

No data found for TZ_fflux.
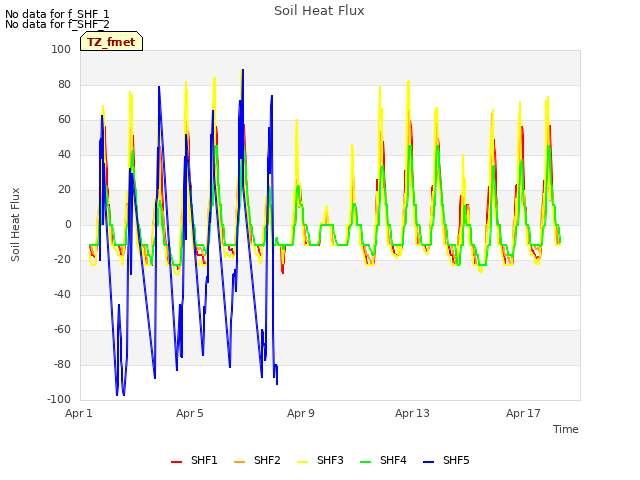
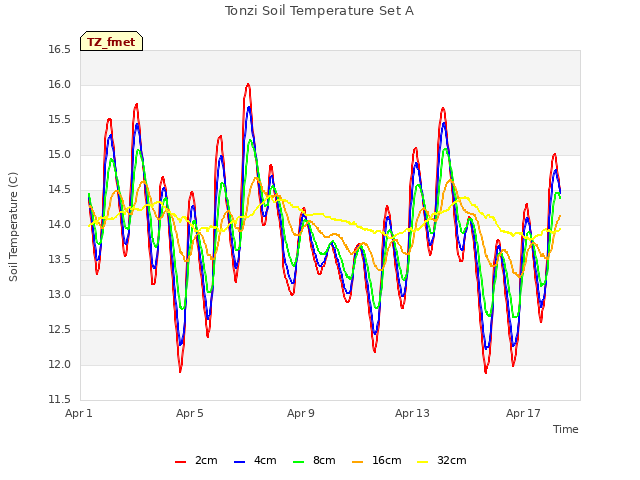
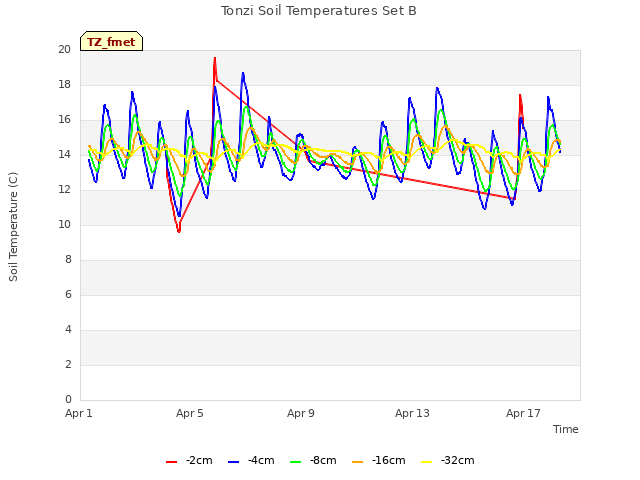
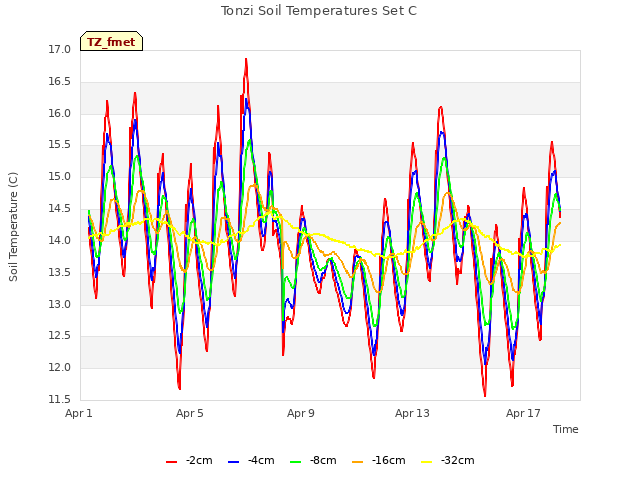
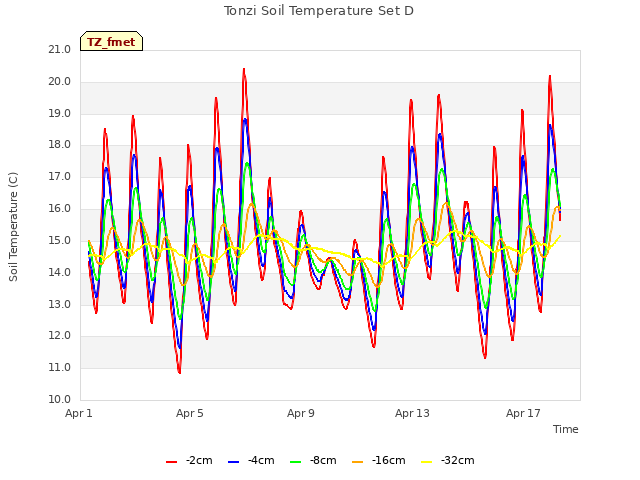
8 TZ_fmet graphs found


No data found for TZ_tram.
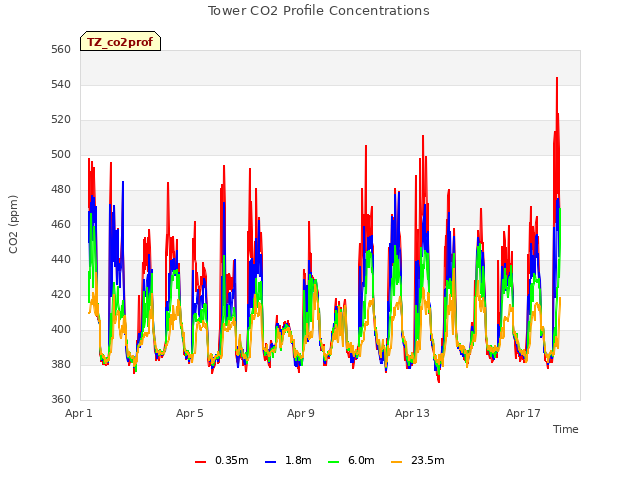
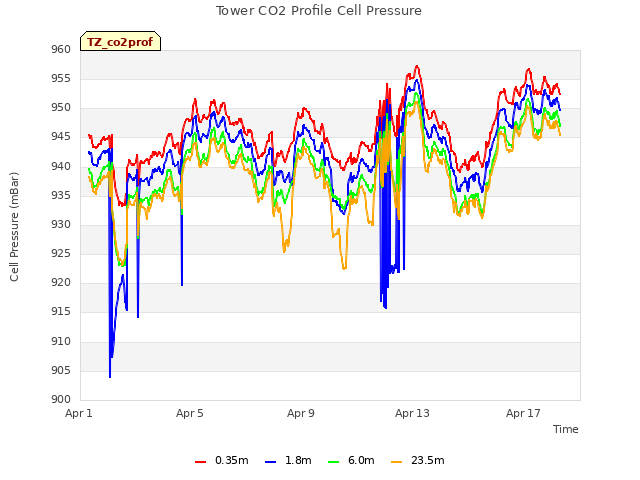
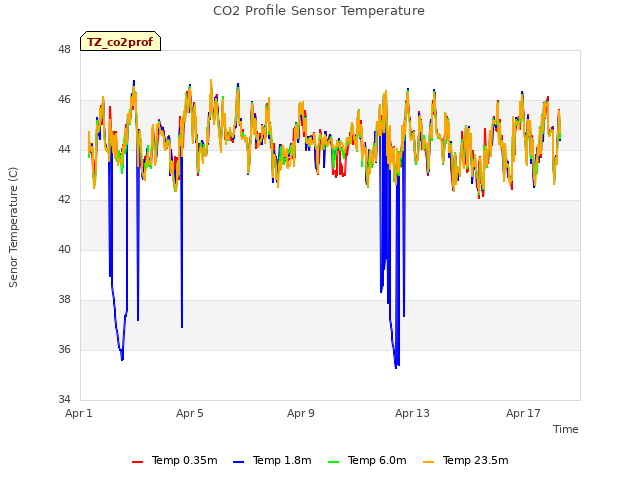
3 TZ_co2prof graphs found
No data found for TZ_irt.
No data found for TZ_windprof.
No data found for TZ_tflux.
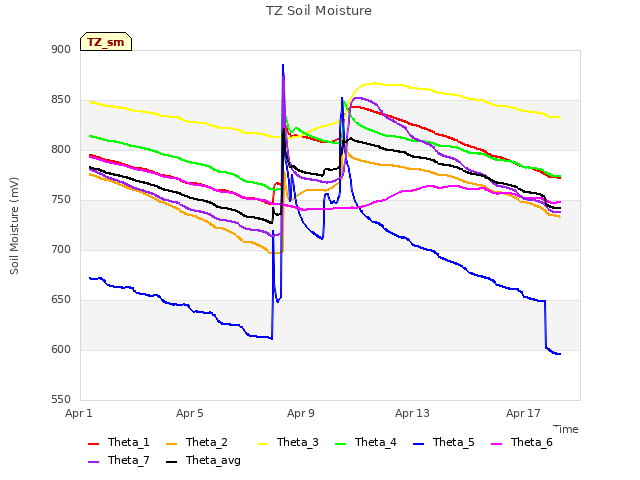
2 TZ_sm graphs found

Can't check TZ_met
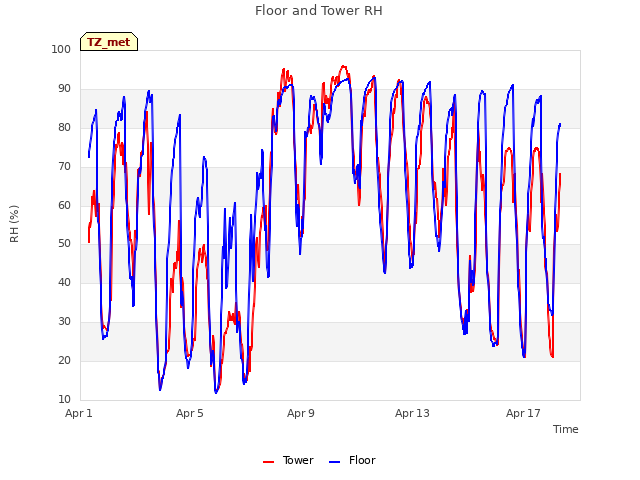
1 TZ_met graphs found
Can't check TZVR_mixed
No data found for TZ_osu.
No data found for TZ_fd.
Tonzi Z-cam data


