
Field Notes
<--2025-02-07 17:00:00 | 2025-03-06 11:00:00-->Other sites visited today: Rush Ranch | Hill Slough
Phenocam link: Searching...
Gilbert Tract: 2025-02-18 15:50:00 (DOY 49)
Author: Kyle Delwiche
Others: Joe Verfaillie, Daphne Szutu, Charlie Diaz
Summary: Calibrated 7700, took dissolved CH4 samples at channel and deployed miniCH4 sensor, rain storms in past few weeks
| Kyle, Joe, Daphne, and Charlie arrived at 15:50 PST. The weather was mild with barely any breeze and slightly overcast. We had a few rain storms in the past few weeks but it doesn't seem to have caused any data loss. A heavy-duty yellow post had been installed off the road and near the flux tower, likely for a security camera. Joe noticed that beavers (probably) have been chewing up our boardwalk posts! The most heavily chewed post is more triangular than rectangular--we'll need to fix this, maybe before the field trip on April 10th. Joe swapped the battery pack for the mini CH4 and Kyle downloaded the data. Joe cleaned the flux and radiation sensors while a grackle yelled at us. Joe removed the PRI sensors from the rad boom. They had been disconnected from the datalogger for a while. We calibrated the 7700 (offsets were small), downloaded met, flux, and cam data (Kyle downloaded again), and the Song Meter Micro data. We did not swap the desiccant and the battery level still read 100%. The 7500 read: 425.7ppm CO2, 423 mol/m3 H2O, 20.59C, 101.98 kPa, 98.7 SS The 7700 read: 2.02 ppm, RSSI 42 – 83 after cleaning Staff gauge was 37cm at 16:53 PST. Kyle measured the surface water conductivity off of the boardwalk. Surface, 292.4 uS, 10.6C Daphne added a 5 minute data preset to met. Charlie took a peat soil core and wetland water sample for his mesocosm experiment. We then drove to the channel. We arrived at the channel around 17:00pm PST, the red-winged blackbirds were very chatty at this time of the evening. We saw 2 swans down the channel from us. Took 3 dissolved CH4 samples: -“tubing” = 2m upslope of EXO. Sample drawn through sampling tube contraption via syringe. -“vial shallow” = 2m upslope of EXO. Sample collected with a Falcon tube attached to a pole and submerged underwater -“vial deep” = 1m upslope of EXO location, also sampled using submerged Falcon tube We had trouble connecting to the ADCP again, even after the "Recover Instrument" option. We tried reconnecting the comms screw terminal and this worked. Kyle downloaded the ADCP data. Last data point was from Feb 2, 20:00. This data since the last download on 2025-01-29 was lumped together with the previous download in the file "GT_20250115_112947.SL," since ADCP files are named by the first date/time, not the last date/time like we are used to. Daphne will edit the ADCP instructions so we stop data collection, download data, then restart data collection to start a new data file between each site visit. Kyle downloaded the EXO data from the CR6. We removed the EXO for calibration but forgot to mark its orientation. Sensors removed: sn 23H107001 EXO sonde sn 24F100050 Cond/Temp sn 24F102410 Turbidity sn 24G102326 pH/ORP sn 22C100780 fDOM sn 24F104086 Wiper Sn 38-576-25 miniCH4 installed. We pressed "3 - setup sampling" to change the sampling start time to 18:30 and then pressed "1 - START sampling". Joe and Charlie pushed the railing back and organized the cables. EXO power was disconnected inside box. We left around 18:15 PST as the sun was setting and the sky getting dark. |
1 photos found
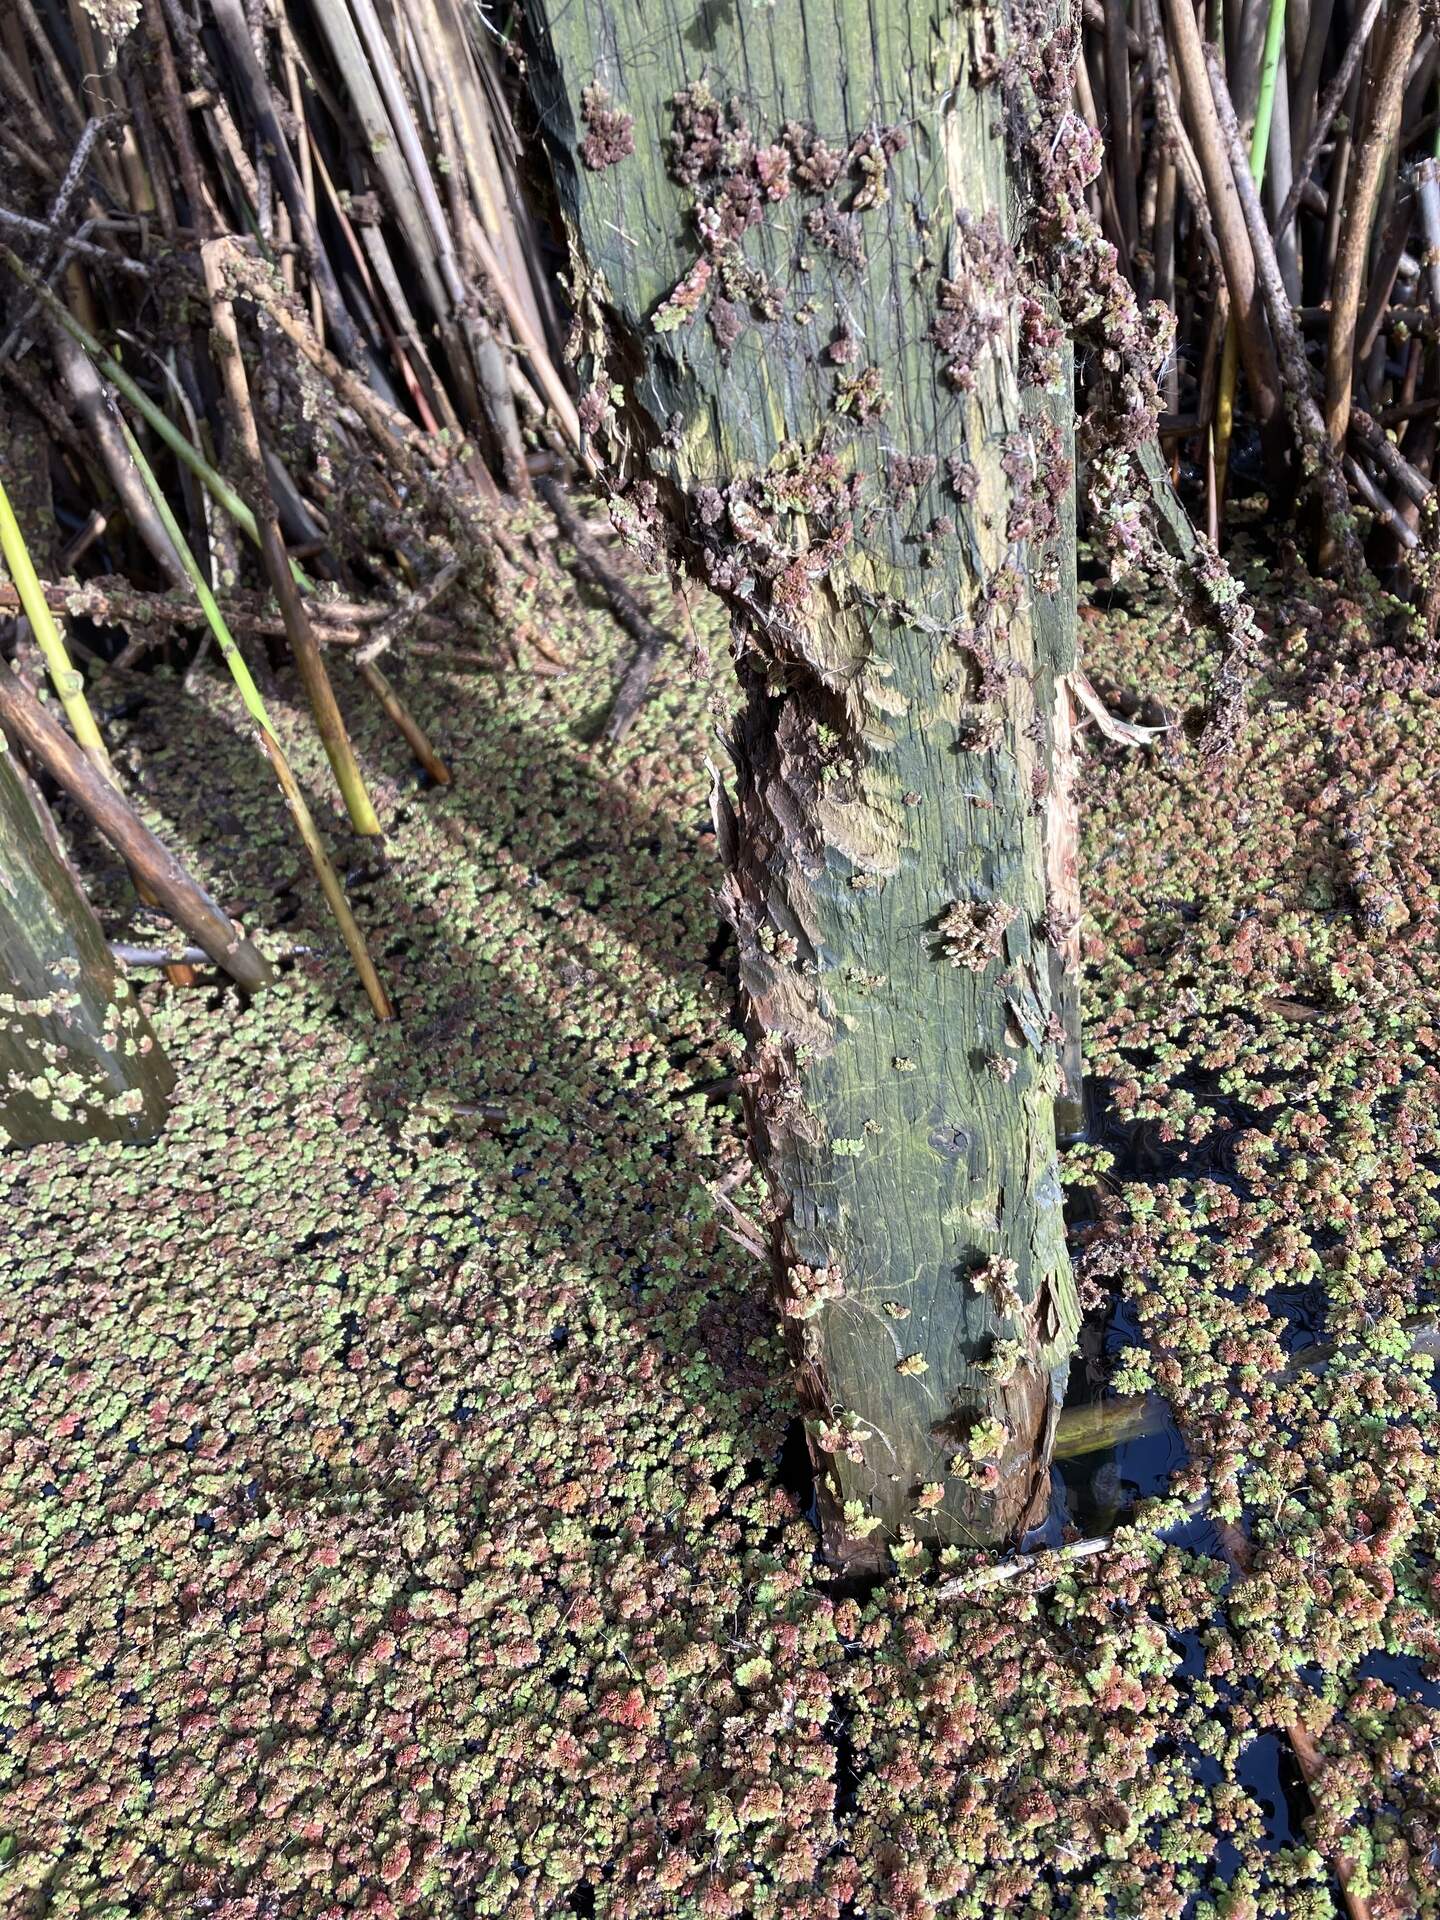
20250218GT_BeaverChew.jpg ( 2025-02-18 15:54:25 ) Full size: 1440x1920
Beavers have chewed almost halfway through 2x4 post
8 sets found
Can't check MBWPEESWGT_mixed
Can't check MBEEWPSWEPGT_cam
16 GT_met graphs found
4 GT_flux graphs found
3 GT_adcp graphs found
1 GT_cam graphs found
2 GT_usgs graphs found
2 GT_chanexo graphs found