
Field Notes
<--2024-12-17 11:00:00 | 2025-01-22 11:20:00-->Other sites visited today: Vaira
Phenocam link: Searching...
Tonzi: 2025-01-09 10:50:00 (DOY 9)
Author: Joe Verfaillie
Others: Dennis, Kuno
Summary: Floor power seems okay, swapped IRGAs for calibration, collected point dendrometer data, reinstalled bottom GMP343, Tree/soil chambers, N2 tank removed
| Tonzi 2025-01-09 Dennis, Kuno and I arrived at 10:50. It was clear sunny and mild with a tiny breeze from the southeast. We have had almost a week of dry weather and no rain in the forecast through late January. The ground is still wet with a big puddle in the road, but the pond and ground water has not come up much yet. Ana Maria was supposed to meet us there but I did not hear from her. I checked on the Floor system to see if the extra solar panel kept its power running. Except for a couple of days after our last visit, seems like there has been full power. I guess it took a couple of days for the battery bank to fully recover. I collected the Floor flux and well data. The wash reservoir was about a half empty. I swapped the 7500 for calibration: sn 0065 came off and sn 0042 went on 0065 read: 446.1ppm CO2, 362.0umol/m3 H2O, 12.6C, 99.8kPa, 98.3SS - 99.0 after cleaning 0042 read: 445.4ppm CO2, 348.8umol/m3 H2O, 12.9C, 99.8kPa, 100.8SS The 7700 read: 2.18ppm CH4, 40.5RSSI - 84.4 after cleaning The 7550 pressure coefficients were set, the clock was set and the box restarted. I did DBH, collected the FD data, collected the TOMST and HISE point dendrometer data and serviced the zcams. I meant to reset the dendrometer on tree 5 but forgot. I collected the road well data. Dennis did the soil moisture and the well measurements including the salinity. Floor, 770 uS, 19.5C Road, 738 uS, 19.2 C Tower, 482 uS, 18.4 C Kuno did his regular round of trunk and soil CO2/CH4 chamber fluxes. Soil CO2 flux has high around 5umol. I collected the data from the tree bole temperature systems - one was missing a couple of days of data due to the power outage. Dennis and Kuno threw discus for a bit too. I collected the tower top flux and camera data. The wash reservoir was about half empty. I swapped the 7500 for calibration: sn 1594 came off and sn 75H-2667 went on. 1594 read: 437.7ppm CO2, 414.1umol/m3 H2O, 13.4C, 99.6kPa, 100.9SS 2667 read: 445.3ppm CO2, 369.9umol/m3 H2O, 15.6C, 99.6kPa, 99.5SS The 7700 read: 2.24ppm CH4, 40.7RSSI - 85.1 after cleaning The 7550 pressure coefficients were set, the clock was set and the box restarted. I reinstalled the lowest GMP343 sn N2220007 fresh from repair. In the lab I could not get a serial connection to it. I brought the same cables to the field and could not get a serial connection to the second lowest GMP either, so something is wrong with the cables I was using. But the good news is that when I plugged the bottom one in it seemed to work without having to change its configuration. I brought in the N2 tank that has been at the tower since the old CO2 profile system. It still had a regulator attached and is nearly full. I was going to remove the solenoid box but it is connected to a wire that probably connects to the current profile system. I'll have to unwrap a splice to see where the wires go. One wire on the fence around the main tower was broken but all the fences seemed to be doing their jobs. We left at about 14:00 |
Field Data
No tank data
Well Depth
| Date | Location | Depth (feet) |
|---|---|---|
| 2025-01-09 | TZ_floor | 30.1 |
| 2025-01-09 | TZ_road | 37.85 |
| 2025-01-09 | TZ_tower | 34.9 |
| 2025-01-09 | VR_well | 59.35 |
No TZ Moisture Point data found
No VR Moisture Point data found
No TZ grass heigth found
No VR grass heigth found
Tree DBH
| Date | Tag# | Reading (mm) |
|---|---|---|
| 2025-01-09 | 1 | 14.5 |
| 2025-01-09 | 102 | 8.8 |
| 2025-01-09 | 2 | 17.6 |
| 2025-01-09 | 245 | 13.7 |
| 2025-01-09 | 3 | 11.0 |
| 2025-01-09 | 4 | 13.6 |
| 2025-01-09 | 5 | 22.7 |
| 2025-01-09 | 6 | 9.9 |
| 2025-01-09 | 7 | 16.5 |
| 2025-01-09 | 72 | 11.5 |
| 2025-01-09 | 79 | 11.8 |
No water potential data found
No TZ Grass Biomass data found
No TZ OakLeaves Biomass data found
No TZ PineNeedles Biomass data found
3 photos found
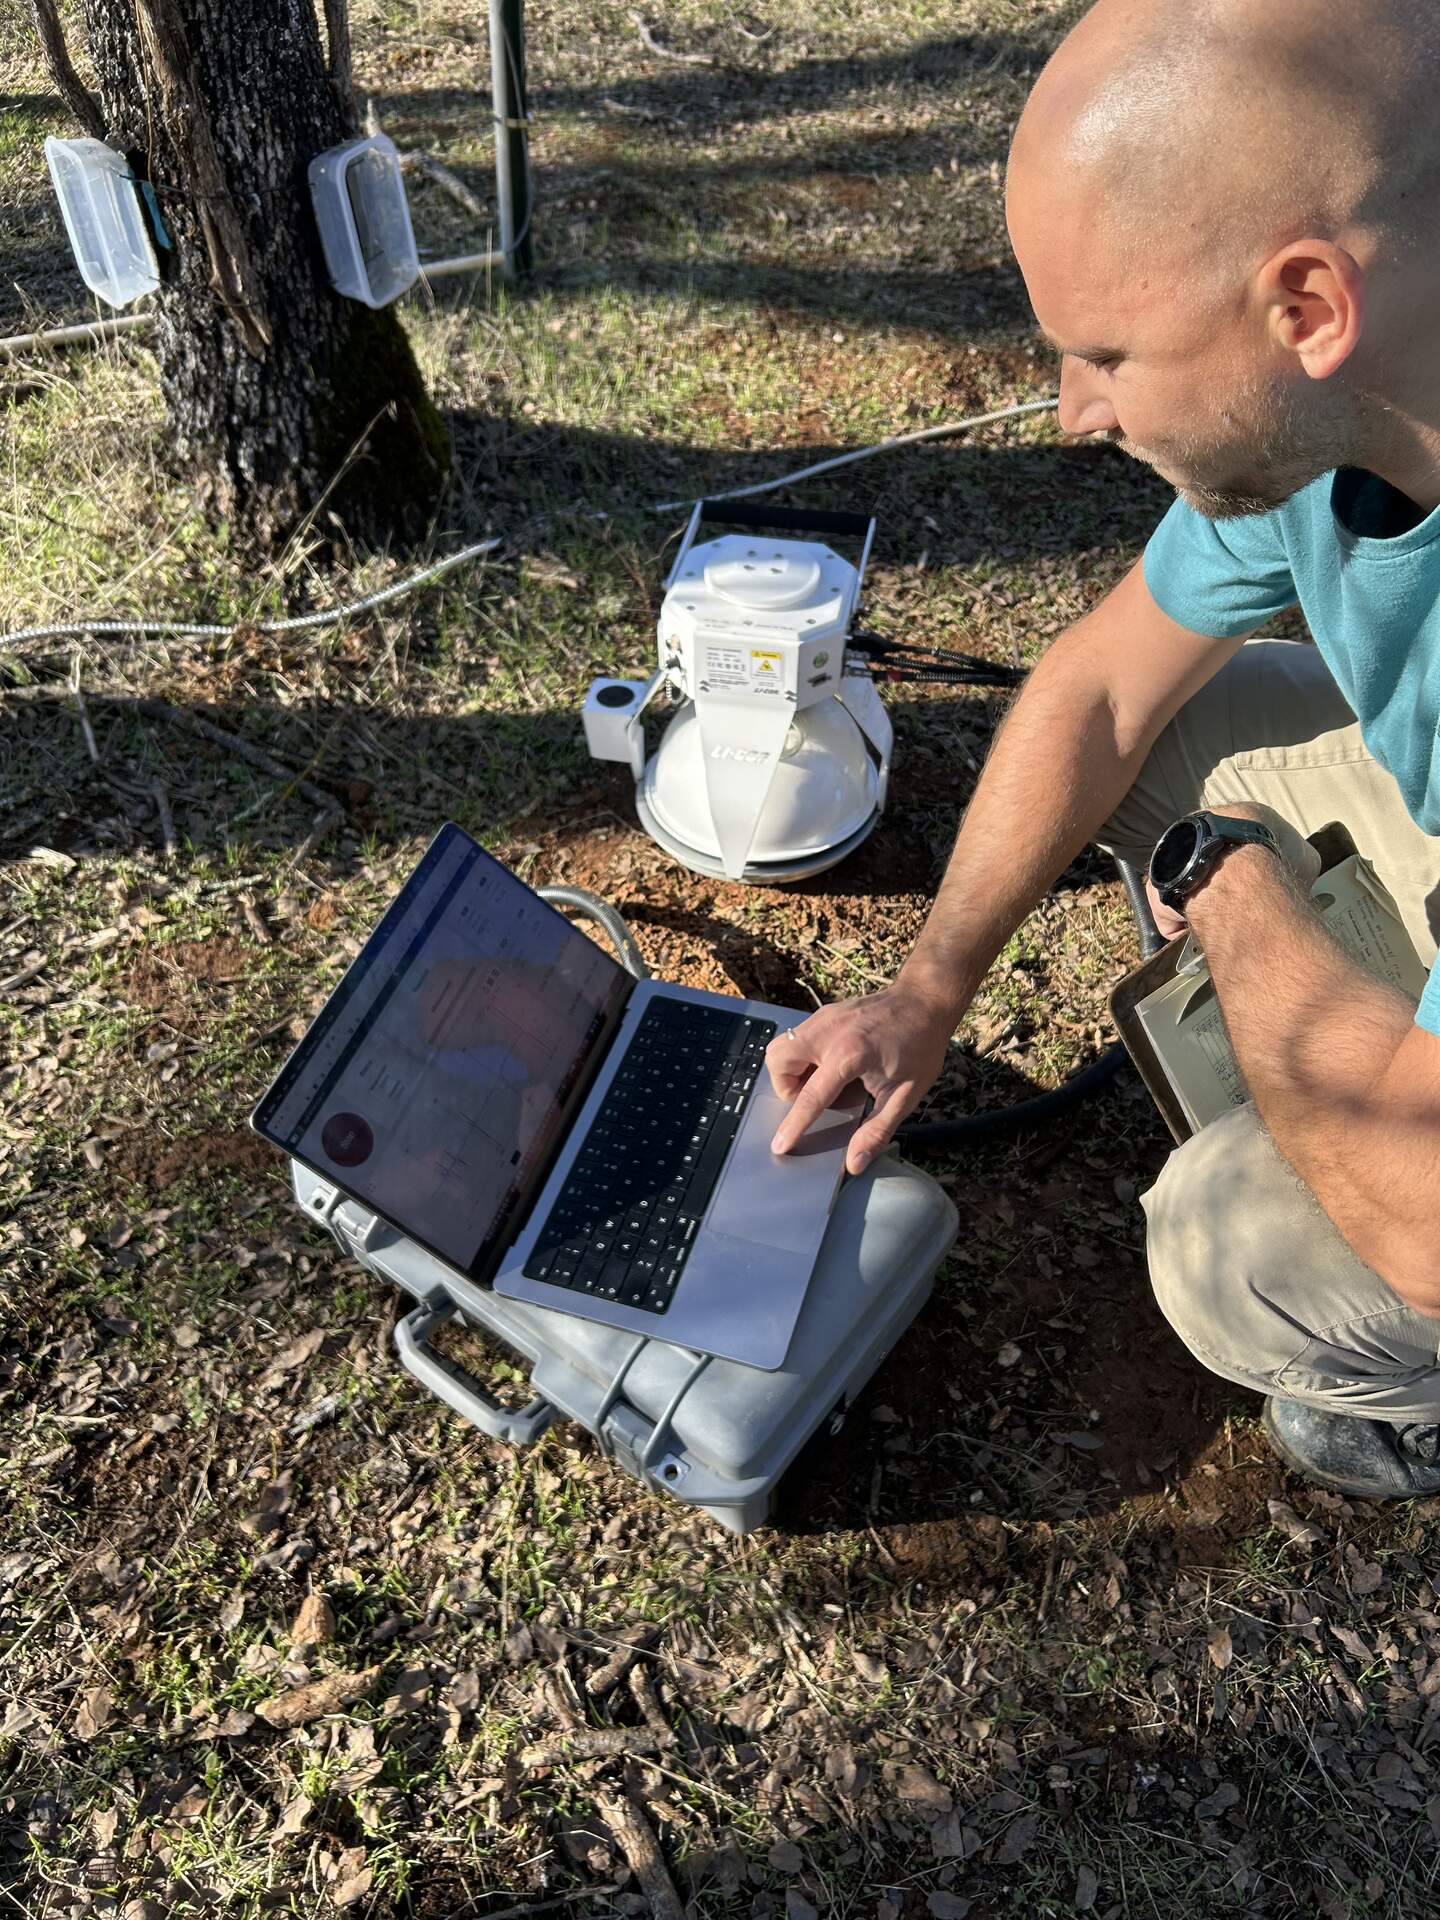
20250109TZ_KunoChamber.jpg ( 2025-01-09 13:36:26 ) Full size: 1440x1920
Kuno taking soil chamber measurements
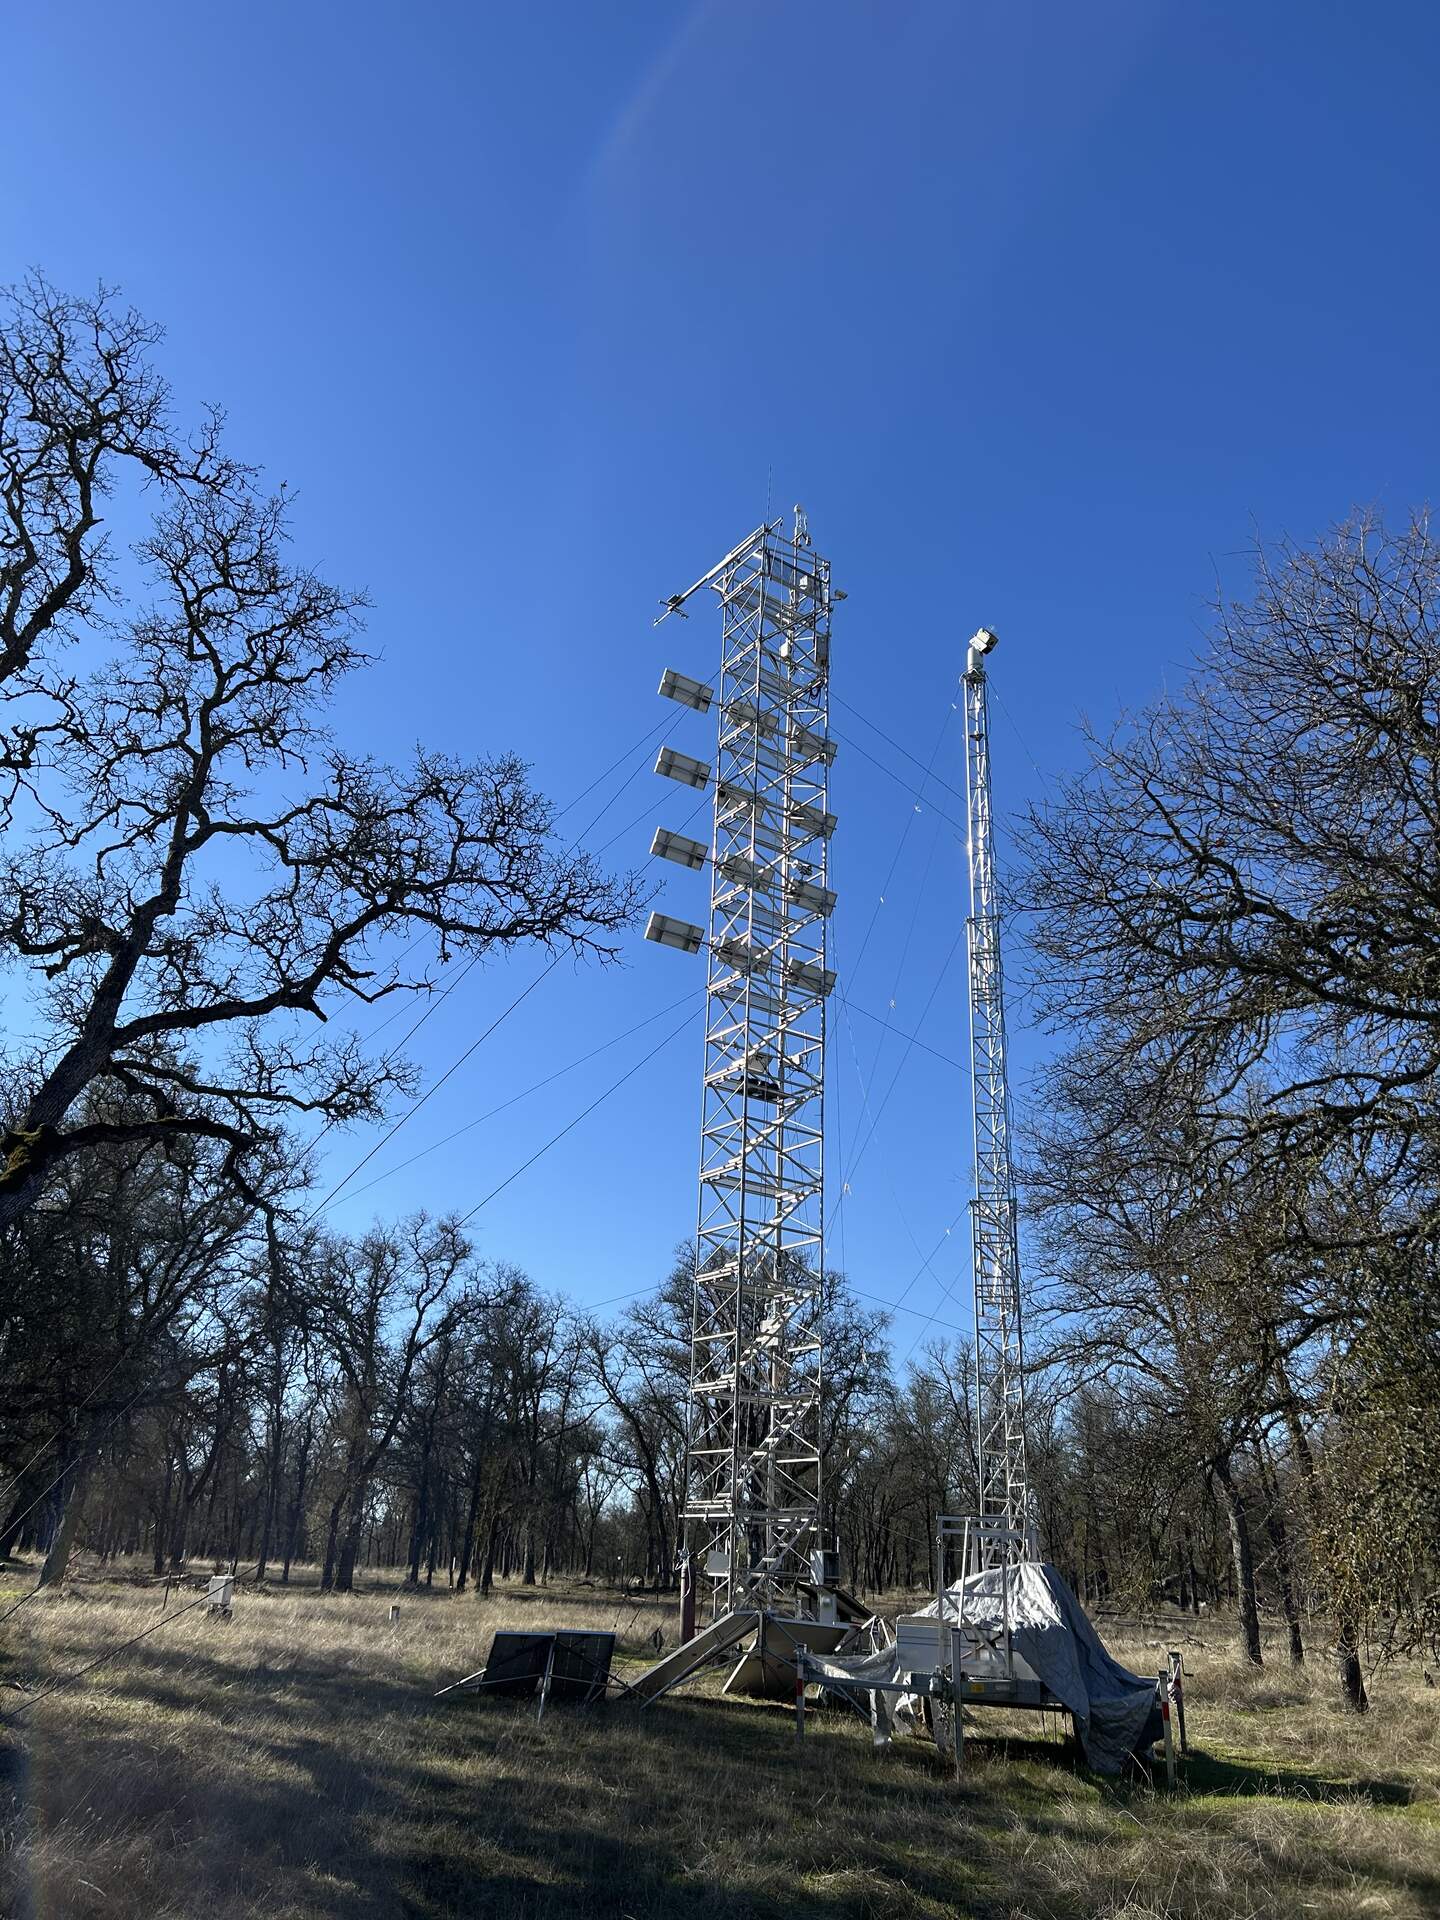
20250109TZ_Tower.jpg ( 2025-01-09 11:04:12 ) Full size: 1440x1920
Eddy covariance tower and Troy's SIF tower
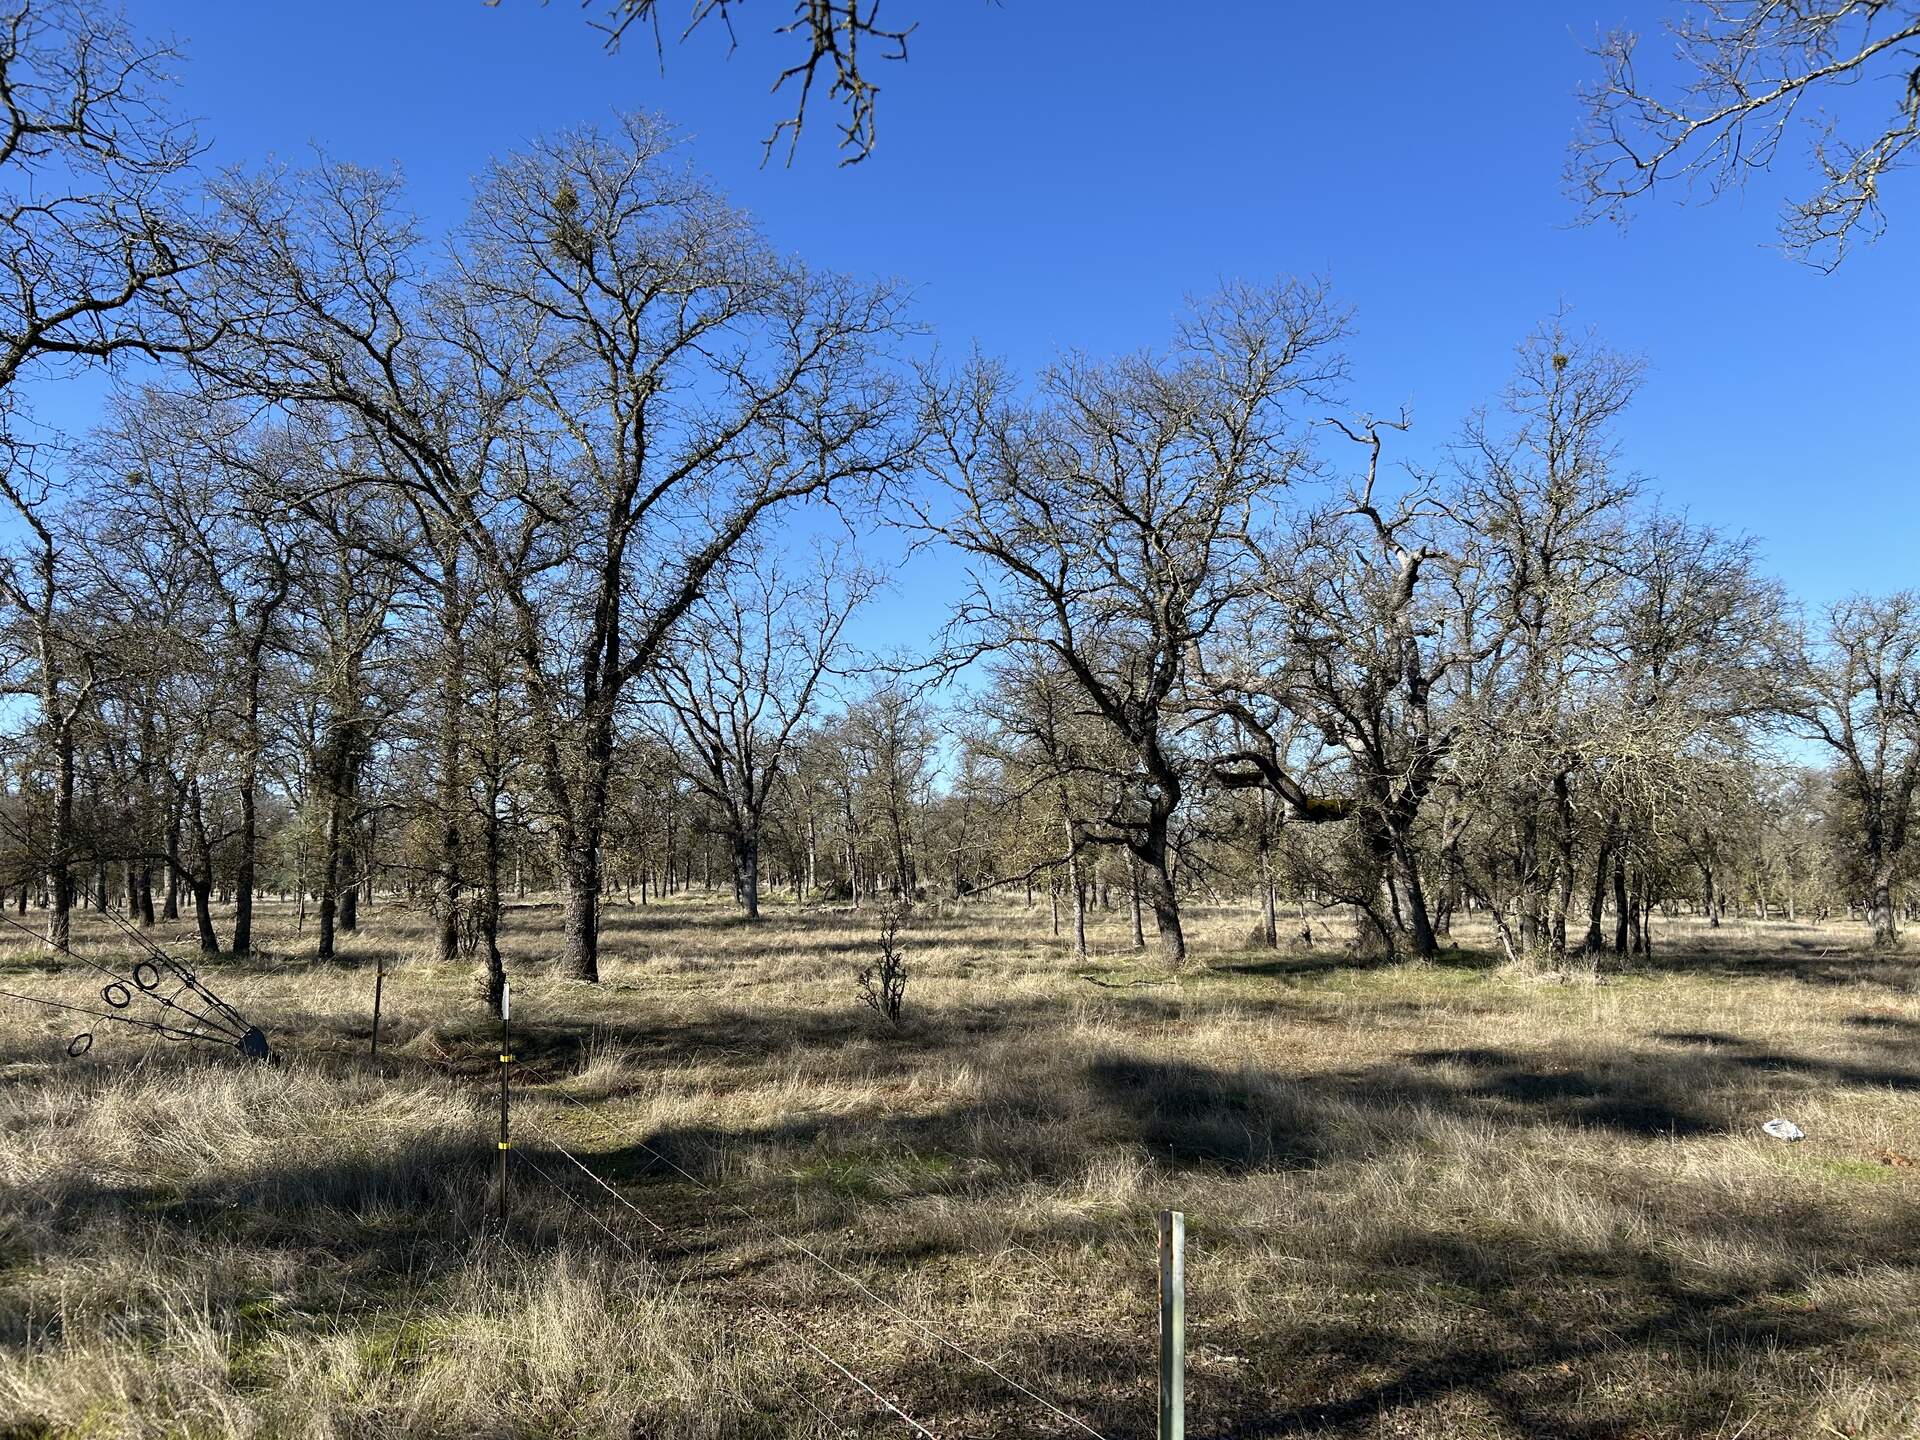
20250109TZ_Trees.jpg ( 2025-01-09 10:59:34 ) Full size: 1920x1440
Bare oak trees with just a glimmer of green grass starting to poke up through the litter
16 sets found
No data found for TZ_Fenergy.
11 TZ_tmet graphs found
No data found for TZ_soilco2.
Can't check TZ_mixed
3 TZ_mixed graphs found
1 TZ_fflux graphs found
8 TZ_fmet graphs found
No data found for TZ_tram.
3 TZ_co2prof graphs found
1 TZ_irt graphs found
No data found for TZ_windprof.
1 TZ_tflux graphs found
8 TZ_sm graphs found
Can't check TZ_met
1 TZ_met graphs found
Can't check TZVR_mixed
8 TZ_osu graphs found
3 TZ_fd graphs found
Tonzi Z-cam data