Field Notes
<--2024-03-25 11:00:00 | 2024-04-09 09:45:00-->Other sites visited today: Gilbert Tract | Bouldin Corn | Hill Slough
Phenocam link: Searching...
Mayberry: 2024-04-04 10:15:00 (DOY 95)
Author: Daphne Szutu
Others: Robert
Summary: Installed Campbell water level sensor, one VWC disconnected--more work needed, three porewater samples
| 2024-04-04 Mayberry Robert and I arrived around 10:15 PST (11:15 PDT). It was cold, breezy, and overcast. It wasn’t raining when we arrived, so I said as much, which of course meant that it started sprinkling about 5 minutes later. I huddled under the upper boardwalk with the laptop. The staff gauge read 16cm. The water is still an almost-bright brown color. The wetland is still overall brown but dark green tules are coming up through the litter. I downloaded the met data and worked on adding Campbell water level sensor sn 20010026 to the met datalogger because the water depth measurement from the HYDROS21 CTD hasn’t been working since February. I added the Campbell sensor to C7 along with the CTD and two VWC sensors we are using for electrical conductivity in the soil. I had to change the SDI-12 address of the Campbell water level sensor from 0 to 6 (last number of its serial number) so it would not conflict with one of the VWC sensors that had SDI-12 address of 0. However, there was still some sort of conflict with that VWC sensor that I couldn’t figure out. I left the VWC sensors disconnected for now; so far the EC of the two sensors are offset but show almost identical dynamics. I’ll try again to connect the VWC sensor when it’s not raining. I uploaded a new CR1000 program. It stores water pressure/temperature from the Campbell water level sensor and stores temperature/conductivity from the CTD sensor. Robert worked on pulling samples from the porewater sippers. He tried them all but only got enough water from 3. Veg-black-black, 9.29 mS, 11.0 C Veg-red-black, 9.31 mS, 11.5 C Veg-red-green, 9.02 mS, 11.8 C Surface, 5.59 mS, 11.8 C We left around 11:30 PST (12:30 PDT). Robert headed off to his family’s house in the Sierra foothills and I headed to Hill Slough. |
1 photos found

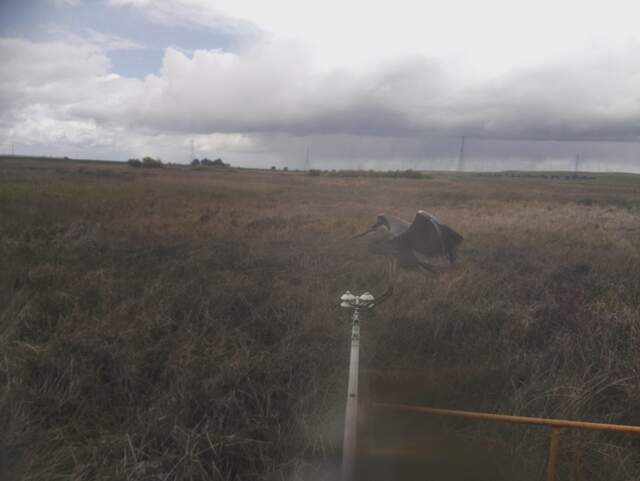
MB_picam_20240404_1315.jpg ( 2024-04-04 13:15:05 ) Full size: 1917x1440
Great blue heron landing on the radiometers
11 sets found
7 MB_flux graphs found
No data found for MB_met.
28 MB_tule graphs found
Can't check MBWPEESWGT_mixed
1 MB_cam graphs found
Can't check MBEEWPSWEPGT_cam
Can't check SIMBTWEE_met
1 MB_minidot graphs found
Can't check MBSWEEWPBCBA
1 MB_processed graphs found
Can't check MB_fd
1 MB_fd graphs found

