
Field Notes
<--2021-11-04 13:50:00 | 2021-12-01 09:10:00-->Other sites visited today: Sherman Wetland
Phenocam link: Searching...
Mayberry: 2021-11-23 10:45:00 (DOY 327)
Author: Daphne Szutu
Others:
Summary: Meant to be a regular site visit but lots of issues because of short in camera power cable. 7550 software/7500 not working, camera off--restarted, met data ok but dfPAR not working, swapped HMP, removed FD chamber, upgraded 7700 firmware
| 2021-11-23 Mayberry I arrived at 10:45 PST after dropping off Ari, Robert, and Carlos at SW for soil sampling. It was overcast, foggy, and cold with an occasional breeze. Two guys were moving hay bales around under the Antioch Bridge overpass and the gate leading up to the levee road was closed. The gas pipeline over Mayberry Slough has been wrapped in a white plastic covering over the scaffolding. The pipeline itself looks the same; it hasn't been painted yet. The grass levee road leading past the trailers to our tower has been mowed. The water level was a little lower than before and the plants are mostly brown, although there are some short green cattails growing up at the water’s edge. The staff gauge read 38cm. There were a lot of problems today at the tower, I think mostly stemming from a short in the camera power cable. Summary of things that don’t work, probably caused by too many power cycles: - 7550 (can’t connect to software properly) - 7500 (no CO2/H2O data despite ok diagnostics) - Sonic SOS data has been bad since 2021-10-25 - dfPAR CR10X (couldn’t connect despite sufficient power) - eosFD chamber (clock was way off even though it’s usually very good) I downloaded the met data. The met box was full of ants. I confirmed the HMP AirT data was continuing to drift downward. I removed HMP45 sn U2120013 and its shield and installed HMP155 sn T2820180 and its new shield and fan. The fan is a 12V fan and powered to the 12V pluggable power strip in the box. The diffuse PAR stopped giving data about a week ago, but the shadow band was still working. The C wire was definitely connected this time. I restarted the CR10X, which didn't help. I confirmed the CR10X was receiving 11.8V of power, but I couldn't connect to the CR10X at all to talk to it. I ran out of time to troubleshoot this. Maybe all the system restarts fried it. There were a couple of power cycles while I was here. I checked the solar charge controller box: all the screws were still snug after Joe tightened them last time. The solar/batt/load amps seemed reasonable. I checked the power junction box where the power comes in and the datalogger enclosure and eddy sensors are powered. This box was chock-a-block full of sleepy wasps. I left the box open the rest of the day to try to shoo them out. I downloaded the FD chamber data. After you finish the download, a little summary box pops up which tells you some data averages and the number of power cycles the chamber has gone through since its last download. Sometimes there are 2-3 power cycles if the solar panels/batteries are not giving enough power. In this case, there were 90+ (!!) power cycles since the last site visit. I was planning on removing this chamber next week for Joe to use at Vaira, but I removed this chamber sn FD20180047 today so we can test it after all those power cycles. I removed the chamber and cable but left the green clasp and mount on the boom. I also reset the FD clock from 6:45 to 11:16—usually the chamber is very good at keeping its clock, so another worrying sign. When I was trying to remove the cable from the chamber, I accidentally loosened the cable port instead, so now the port is loose and I'm not sure if it's still sealed against the body of the chamber. Another thing to inspect in the lab. I lifted the boom up twice during the day so there may be weird data in the dissolved O2 and dissolved CO2 data. I tried to download the camera data, but there were no photos on the card. The camera lens was stuck in the extended position and I couldn't turn the camera on or off. There were a few small cracks in the wires between the DC-DC converter and the camera, but after some more sleuthing I found the real problem was that the power cable down by the boardwalk was chewed and probably shorting our whole system. I snipped off the exposed section and there was enough slack to re-route the power cable into the datalogger box. I turned the camera on and I was prompted to set the clock. I had to turn the camera off and unlock the SD card to set the clock. I set the clock to PST, relocked the SD card, and set up the camera in its usual intervalometer. I downloaded the stardot photos, which seemed to all be fine (one of the few things that seemed to be fine today). I downloaded the USB GHG data, which seemed to have the right number of files but did have a lot of unzipped files because of all the power cycles. I was able to open the 7700 software without issue. I heard the 7700 mirror spin at 11:00 right after I arrived, so I updated the 7700 firmware for sn TG1-0223 from v1.0.27 to v1.0.29 as James K. suggested. It’s a minor update (adding diagnostics/charting), but I think it helped. I’ll have to pay more attention to it next time as there was too much going on today. Looking at the data back in the lab, the 7500 data stopped on 2021-11-17, and the sonic SOS has been bad since 2021-10-25. I had a really hard time opening the 7550 software properly. A new error message would pop up every ½ second and I couldn’t press “Enter†fast enough to dismiss the message and actually click much in the interface. I tried a bunch of stuff to see if the 7550 software would boot properly: - Reset the 7550 - Stopped logging, removed the USB and reset the 7550 - Disconnected all the sensors from the bottom of the box and reset the 7550 - Unplugged the power for about 10 minutes before repowering the 7550 None of these worked to solve the problem in the 7550 software v8.9.0 or v8.8.36. I called Licor and Eric said it’s probably a problem with the lat/long being saved as a text string instead of as a number. He sent me a word doc that explained how to check it: download the full configuration file, change the lat/long parameters, save it as a new configuration file, and then re-upload the new configuration file. In addition to the 7550 software acting weird, there was also something wrong with the CO2 sensor. The CO2 and H2O values on the dashboard were ***, and the SS was 0. I tried unplugging and replugging the cable at both the sensor and the 7550 and restarting the 7550, but that didn’t help. At this point I called Ari to check in. They had broken 2 of the 3 mallets I had packed for their coring and were afraid the 3rd mallet would go the same way so they asked me to go pick up a ~12 lbs. sledgehammer. I left Mayberry around 13:00, drove to the Oakley Ace Hardware, and bought a 10 lbs. sledgehammer and a few pairs of gloves because the sledgehammer handle was already splintery. I picked up the 3 of them from the SW tower site and dropped them and their equipment off at the hotspot site for their next core. I arrived back at Mayberry around 14:55 and tried Eric’s suggestion of checking the new lat/long. I was able to download the configuration file, but the lat/long parameters were still the expected numbers. We still have some older versions of the 7550 software installed on the field laptop, so I was finally able to launch the software properly using v8.5.0. The CO2/H2O were still reading *** even though the diagnostics all looked ok. I tried reloading the latest 7500 configuration file from 2021-09-29, updating the pressure coefficients, and resetting the 7550—still no CO2/H2O data. I went through the Site Setup tab and noticed that the sonic was set as a Gill HS50 instead of a Gill WMP. I set it to the correct Gill WMP and re-entered the sonic analog coefficients. The 7700 tab had also lost in a northward separation so I added it back in (we don’t use this separation distance but the 7550 software throws an error if it’s not added). I reset the 7550, optimistic, but there was still no CO2/H2O values and the sonic had reverted back to the Gill HS50. I’m not sure if the HS50 issue is just a software thing; I downloaded the full configuration again and the sonic parameters say “Gill WM,†which is neither the HS50 or the Gill WMP. The last thing I tried was uploading a full 7550 configuration saved from MB from 2017-09-13. I then uploaded the most recent 7500 calibration config file from 2021-09-29 and updated the pressure coefficients. Still no CO2/H2O data and still can’t launch the 7550 software v8.8.36 or v8.9.0. It was too late to call Licor at this point so I’ll e-mail them back in the lab. Next time I’ll bring a spare 7550 and 7500 to swap out so we can troubleshoot it further in the lab I cleaned the flux and rad sensors but I didn’t have alcohol (forgot the blue bag) so I used DI water instead. The wash reservoir was ½ full; I refilled it. I didn’t have the jar of mothballs with me. There were 3 half-melted mothballs in the solar charge controller box, so I took 2 out, 1 for the datalogger enclosure and 1 for the power junction box. I had a Raspberry Pi cam with me ready to install, but I decided to wait to see if the power problem is fully fixed. No point in putting up this camera just to have its SD card corrupted again. LI-7500 readings: CO2 ** * H2O *** T 12.7C P 101.7kPa SS **LI7700 readings: CH4 2.4 RSSI 30 --> 67 after cleaning I left at 16:20 to pick up Ari, Robert, and Carlos at the SW hot spot location. The breeze had calmed down by now and Mayberry Slough was still enough to make a nice reflection of dusk. Back in the lab, we helped Ari set up the sheepherder’s jack by the sink so she could extrude and slice the rest of the 2nd core and preserve the samples ASAP. Thank you for reading my novella. |
3 photos found
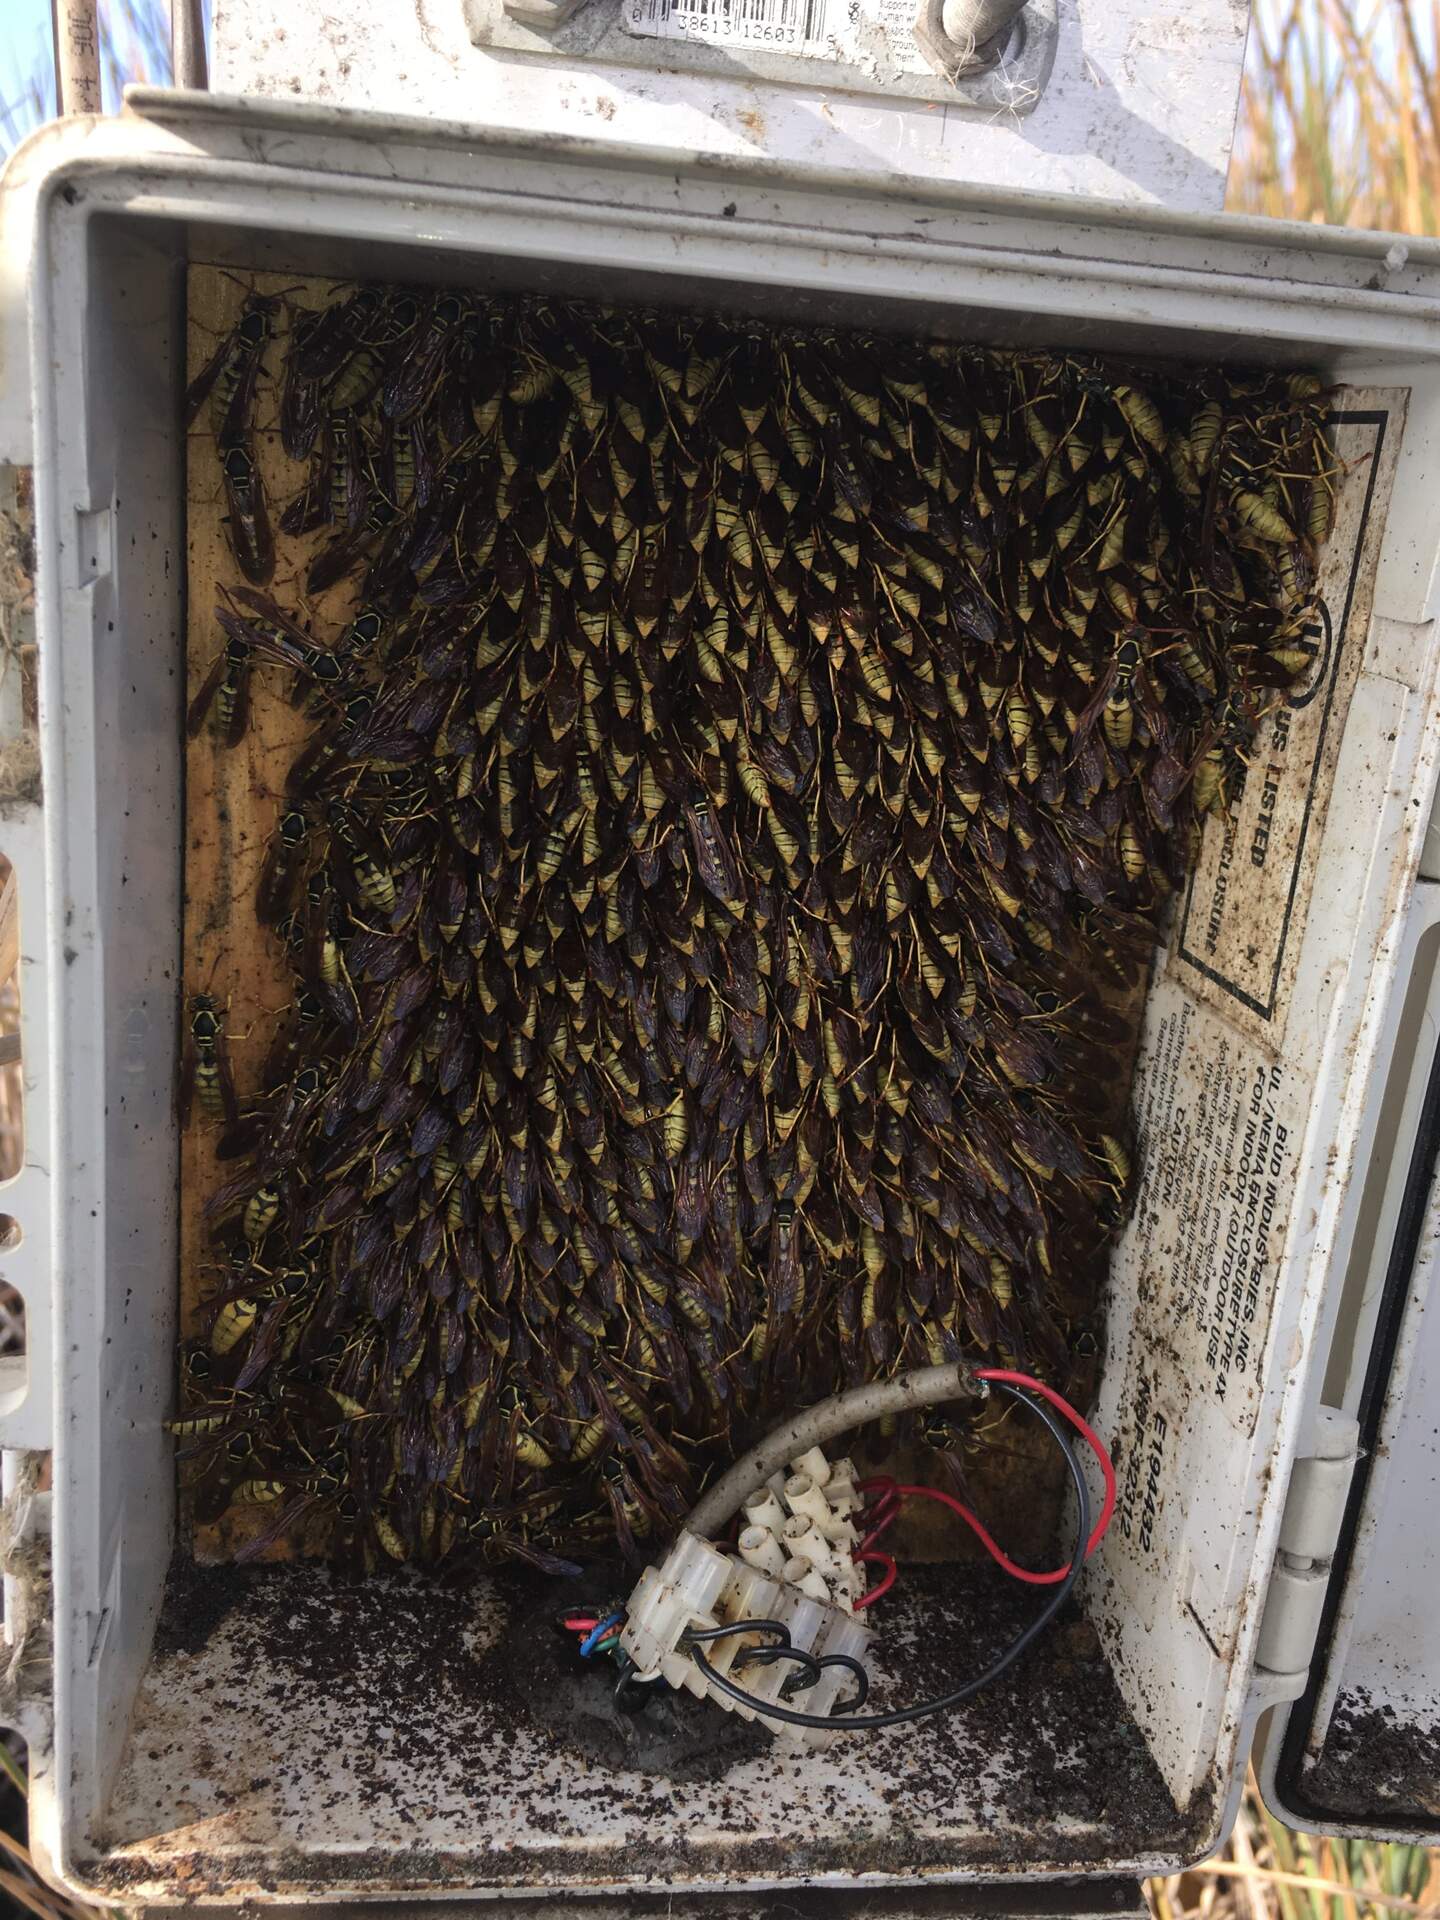
20211123MB_WaspsGalore.jpg ( 2021-11-23 11:38:07 ) Full size: 1440x1920
Wasps snuggled together in the power junction box
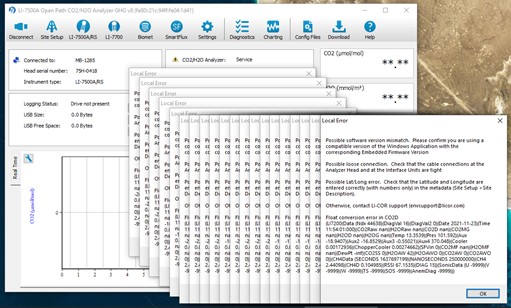
20211123MB_7550Error.jpg ( 2021-11-23 00:00:00 ) Full size: x
7550 error message that kept coming up one after another. I had to use Task Manager to kill the 7550 software.
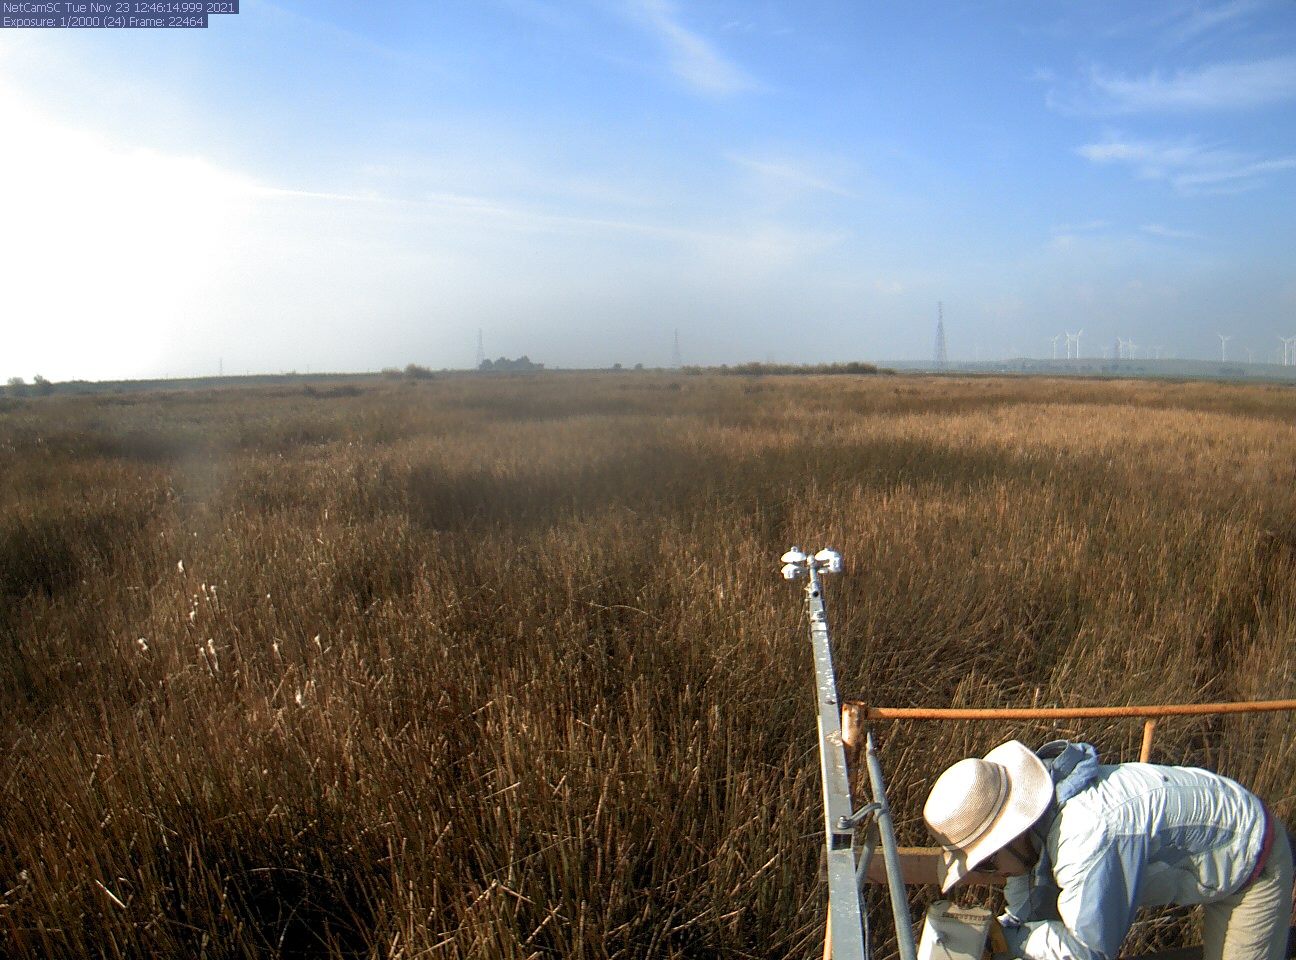
MB-stardot_2021_11_23_124612.jpg ( 2021-11-23 12:48:20 ) Full size: 1296x960
Daphne on site
11 sets found
7 MB_flux graphs found
No data found for MB_met.
28 MB_tule graphs found
Can't check MBWPEESWGT_mixed
No data found for MB_cam.
Can't check MBEEWPSWEPGT_cam
Can't check SIMBTWEE_met
1 MB_minidot graphs found
Can't check MBSWEEWPBCBA
1 MB_processed graphs found
Can't check MB_fd
1 MB_fd graphs found