Field Notes
<--2021-05-13 10:55:00 | 2021-06-02 10:00:00-->Other sites visited today: Bouldin Alfalfa
Phenocam link: Searching...
Bouldin Corn: 2021-05-27 12:15:00 (DOY 147)
Author: Joe Verfaillie
Others: Daphne
Summary: Pulled weeds, move tower to edge of field, moved ground sensors into the field, added cameras for gap fraction, calibrated 7700, added cal kit for radiometer inter-comparison, check mux wiring RE dropped data.
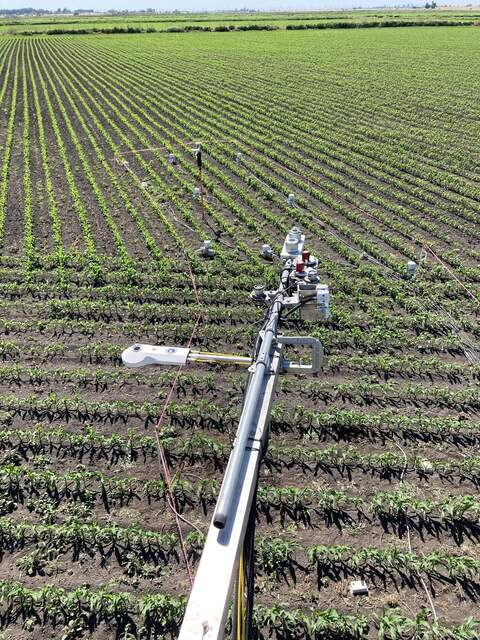
| Bouldin Corn 2021-05-27 Daphne and I arrived at about 12:15 PDT. It was clear sunny and warm with a strong gusty breeze from the west. The corn is getting taller but still only about 30cm – see veg heights. There are lots of weeds coming up in patches in the field – I expect they will spray it with herbicide. We pulled most of the weeds in front of the tower by hand. The surface was dry and dusty but just a few cm deep the soil was damp. The main job today was to move the tower to the edge of the field and to install the ground sensors in the field. We disconnected the tie downs and pulled up the ground sensors from under the tower – one heat flux plate (probably #2) was in an air pocket not making much contact with the soil. Then Daphne and I were able to walk the tower forward to the edge of the field one side at a time. I reinstalled the tie downs – two fence post and two screw-in anchors. The screw-in anchors are more work but can be removed and installed without special tools. After moving the tower sonic sn 153803 new heading is 353 degrees true. We installed all the ground sensors in the field. The Theta probe is at the surface. The Campbell probes are at depths: sn 17129 0-12cm, sn 17133 10-22cm, sn 17128 20-32cm. I removed the 12 inch collar from the FD chamber and installed it in the field without a collar and only two tie downs. The cable for the well sensor was not long enough and we didn’t have the post hole digger so the well sensor is hanging in the air for now. We added the two pi-cams for gap fraction: sn RPI0W-001 in line with a row and sn RPI0W-002 between rows. These are running the new code with the options to skip nighttime photos and add descriptive text to the file names. Their clocks seem to run fast so it’s a good idea to keep an eye on their times. SSH is enabled and the date time can be set with the following command: sudo date –s “Thu May 27 14:23:40 -08 2021†We calibrated the 7700 sn TG1-0224 – all seemed well. Daphne collected the data, power cycling the PA and clearing the FD memory. The 7500 read: 410ppm CO2, 397mmol/m3 H2O, 27.8C, 101.6kPa, 102SS The 7700 read: 1.98ppm CH4, 43.1RSSI – 73.1 after cleaning. There have been lots of drop outs in the sensors on the AM16/32 multiplexor recently. Daphne unplugged and re-plugged the connectors to the mux and check to make sure the wires were secure. We added the cal kit to the tower including the Apogee NDVI sensors we removed from BA. CR1000 sn 23865 CNR4 sn 121038 PAR sn 060831 NDVI in sn 1049 NDVI out sn 1050 We measured veg height. We left at about 16:00 PDT |
Veg Height (cm): Tape measure from ground to top of plant
23, 30, 32, 26, 24, 42, 37, 35, 20, 28, avg = 29.7, stdev = 6.88
1 photos found

20210527BC_Radiometers.jpg ( 2021-05-27 15:39:58 ) Full size: 1440x1920
Radiometer inter-comparison and ground sensors in background
6 sets found
17 BC_met graphs found
5 BC_flux graphs found
Can't check TATWBABCSB_cam
Can't check MBSWEEWPBCBA
2 BC_pa graphs found
1 BC_arable graphs found

