
Field Notes
<--2021-03-11 09:30:00 | 2021-03-25 09:00:00-->Other sites visited today: Sherman Wetland | Mayberry | West Pond | East End | Bouldin Corn | Bouldin Alfalfa
Phenocam link: Searching...
Hill Slough: 2021-03-16 09:20:00 (DOY 75)
Author: Daphne Szutu
Others:
Summary: First site visit after setup, added precip bucket, fixed RH mux port, adjusted camera view, uploaded new config file for 7500
| 2021-03-16 Hill Slough I arrived at 9:20 PDT. It was cold but not too chilly in the sun. Skies were mostly clear. I could hear a lot of water birds as well as Travis AFB planes and helicopters droning above. The gates, locks, fencing panels, and extension cord all looked undisturbed. I downloaded met, cam, and USB GHG data. The RH data was bad because I had put in the wrong multiplexer port, so I fixed that. There was also an extra TC column in the data table (TC25) because we only have 24 TC here. I installed a precip bucket on the SE corner of the scaffolding, sn 48130-611. I uploaded a new CR1000 program with these changes: added precip bucket, removed TC25 from the data table, and changed RH mux port. The camera files looked fine, and I slightly adjusted the camera view. I think the picam is a few minutes off from the laptop time, but I think it’s probably ok for now. I didn’t test if SSH was enabled on this picam. The 7550 had a 7700 time sync error, which went away after resetting the box. I had changed the 7550 name last time from SWTT-650 to HS-650, but I’m not sure why the name didn’t stick. It seems to stick now after resetting the box. The GHG files were named “SWTT-650,†but I can fix that with the Renamer tool back in the lab. I uploaded a new config file for 7500 sn 75H-2180, updated the pressure coefficients, and reset the box again. I checked that the USB was logging and the 7700 was connected. The previous config file was for a previous calibration of sn 75H-2180, so I don’t expect to see much difference in the GHG values with the new config file. I topped off the reservoir and cleaned flux and rad sensors. LI-7500 readings (sn 75H-2180 with old config file --> sn 75H-2180 with current config file): CO2 424ppm --> 427 H2O 360ppm --> 328 T 12.1C --> 12.3 P 102.0kPa --> 102.0 SS 97 --> 98 after cleaning LI7700 readings: CH4 2.01ppm RSSI 51 --> 72 after cleaning I left at 10:30 PDT. |
1 photos found
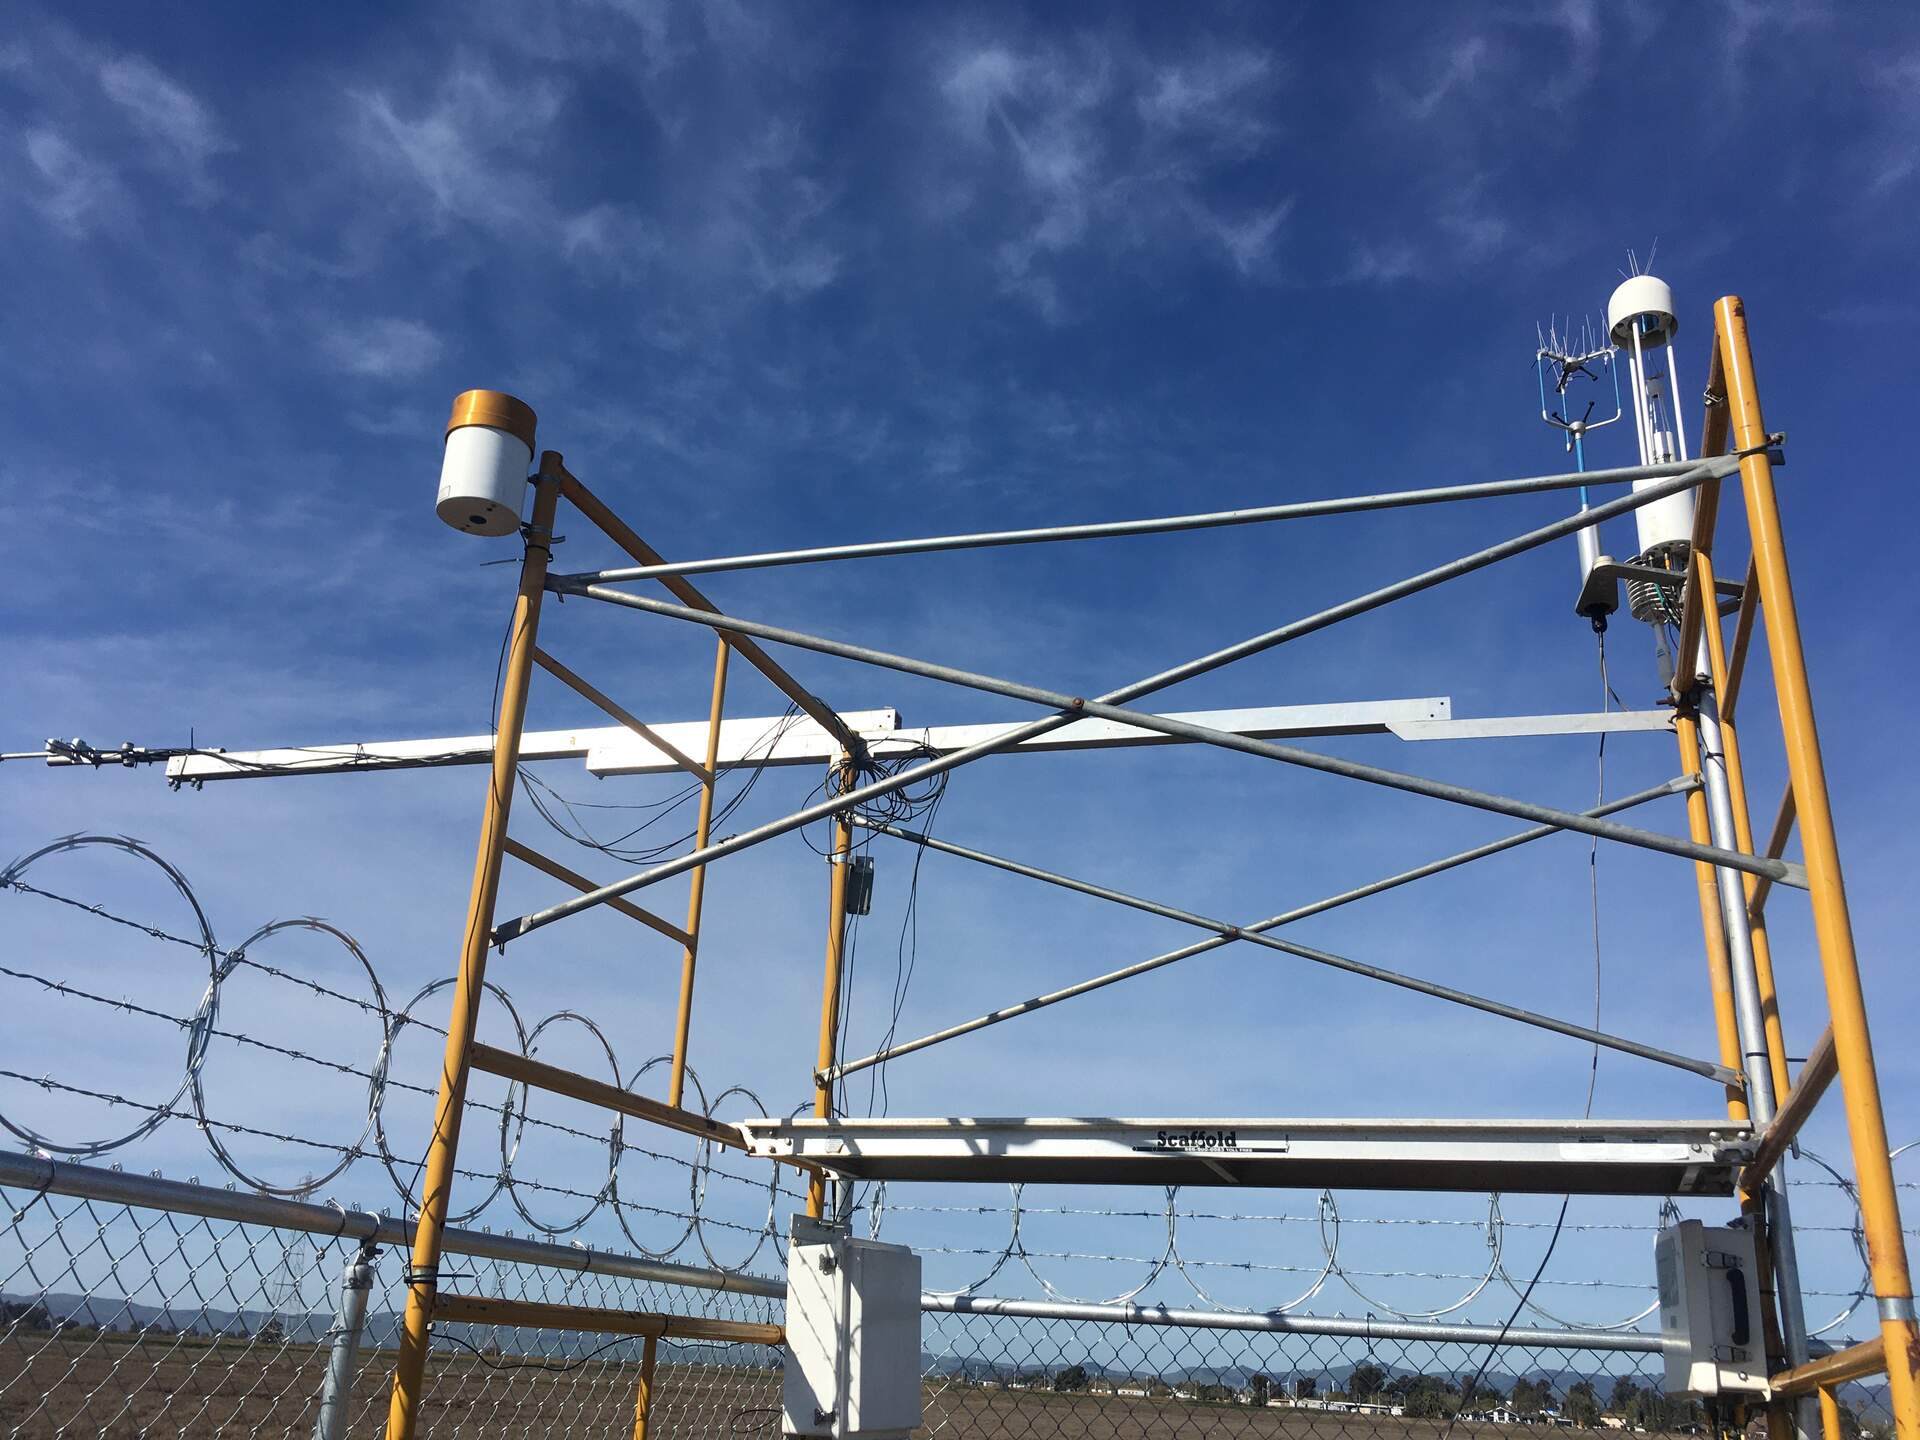
20210316HS_InstrumentTower.jpg ( 2021-03-16 10:28:04 ) Full size: 1920x1440
Precip bucket installed on the SE corner of the scaffolding, radiation boom pointing south, flux sensors on NW corner of scaffolding.
4 sets found
21 HS_met graphs found
4 HS_flux graphs found
1 HS_cam graphs found
Can't check HS_Processed
2 HS_Processed graphs found