Field Notes
<--2010-05-03 12:30:00 | 2010-05-11 13:00:00-->Other sites visited today: Twitchell Rice
Phenocam link: Searching...
Sherman Island: 2010-05-05 13:00:00 (DOY 125)
Author: Joe Verfaillie
Others: Dennis, Jaclyn, Liukang, Chris
Summary: Calibrated the LGR, Picarro equipment gone.
| Sherman
5/5/2010 Arrived about 1pm with Dennis, Jaclyn and Liukang and Chris from Licor. Warm and sunny, less wind than Twitchell and more from the north. Field and ditches are dry except for the ditch along the road that seems relatively high. Cows were in the far west end of the field. Systems were running. Dennis and Jaclyn did field measurements and calibrated the LGR. Sherman: cal gas 1.976ppm CH4, 17.56us, 156 Torr, 27C pre-cal: 1.980 post-cal: 1.977 Note: Sherman cal gas tank is down to 700psi Initial readings from the LGR were: 13:03pm, 25.85C, 140.91Torr, 17.742usec, 10Hz, 1.886ppm I finally got the data logger serial ports sorted out: Com1 - Met Com3 – CR1000 Com4 – FastRad Com5 – SoilMoist Com6 – SoilCO2 The soil CO2 serial line is still not working. I brought the connectors in to test in the lab. The Picarro equipment is gone. I turned off the breaker to the power line they were using. Copied some of the met data and photo missed on Monday. Left about 2:30pm |
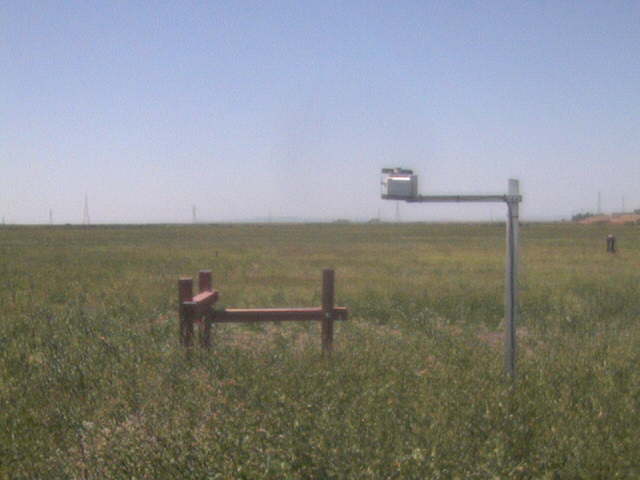
4 photos found

SI_webcam_20101251235.jpg ( 2010-05-05 12:35:08 ) Full size: 640x480
Someone doing fieldwork.

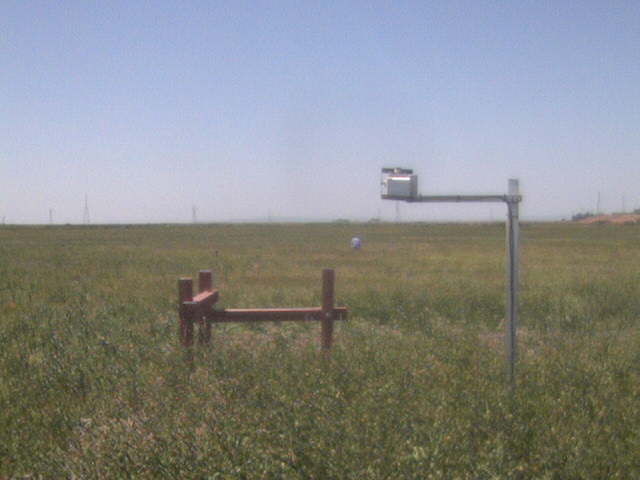
SI_webcam_20101251225.jpg ( 2010-05-05 12:25:04 ) Full size: 640x480
Someone doing fieldwork.

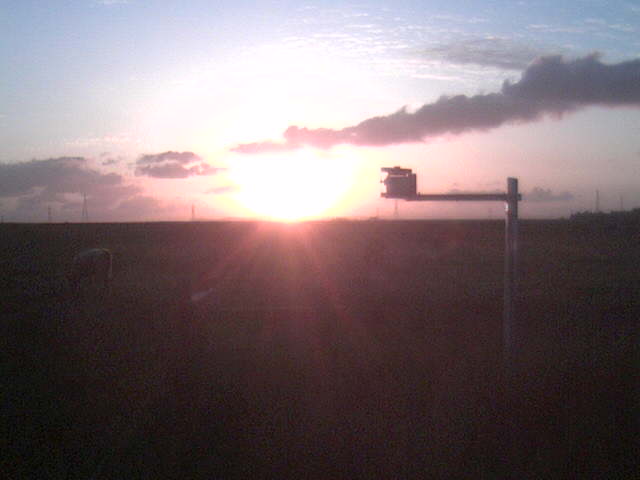
SI_webcam_20101171845.jpg ( 2010-05-05 07:12:00 ) Full size: 640x480
Nice Sunset.

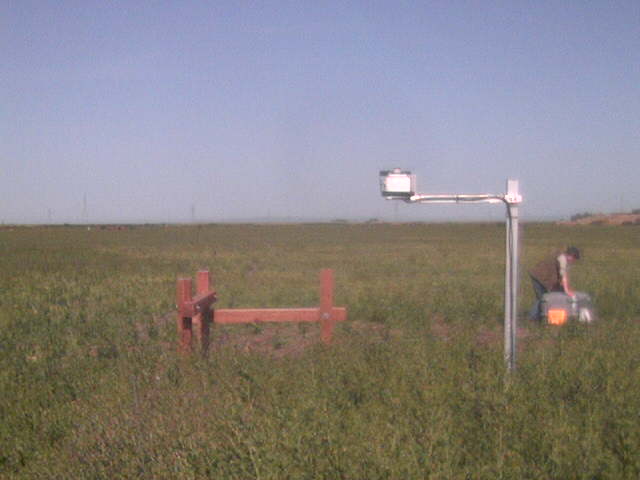
SI_webcam_20101150855.jpg ( 2010-05-05 07:11:59 ) Full size: 640x480
Someone doing field work.
7 sets found
No data found for SI_mp.
11 SI_met graphs found
Can't check SI_mixed
2 SI_mixed graphs found
No data found for SI_flx.
2 SI_soilco2 graphs found
Can't check TWSI_mixed
Can't check SIMBTWEE_met

