
Field Notes
<--2002-06-06 15:10:00 | 2002-06-20 04:15:00-->Phenocam link: Searching...
Tonzi/Vaira: 2002-06-13 09:30:00 (DOY 164)
Author: LiuKang Xu
Others:
Summary: Problems with Floor system watch dog, oak leaf ACi curves, Vaira sonic N is facing west.
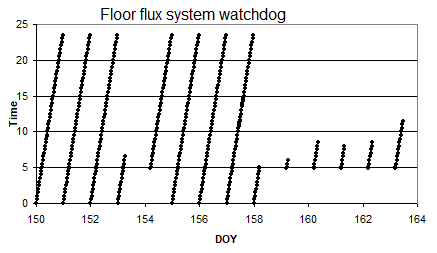
When: June 13, 2002, d164 Thu Trip Purpose: check 3 flux systems and download data, soil moisture probe reading, dendrometer reading, A/Ci curve for oak leaf at Tonzi Ranch. All setup files for three flux systems are same. Problem: The flux system at floor was only running a few hours a day since Dennis and Ted’s last trip on June 6, 2002 (d157). See the watchdog figure. I guess it might be due to the pc208 task? You guys modified something with pc208 task?
Tonzi Ranch: Arrived at 9:30 am, Finished 3 A/Ci curves on oak leaf. Dendrometer reading:
Soil moisture probe reading:
Floor flux system: Fence working good. Gillsonic program was frozen. During last week, every day the system was running only for a few hour. See the watchdog above. Also only CR23X3 data logger was communicating with pc. We got tz3_021??.23x file every day. There was no communication between other data-loggers with the pc. But after I rebooted pc, all the data (cumulated from last whole week) did transfer to the PC. I don’t know what’s wrong ? PV reading 13.9V, 13.2A, and 1.7A. Setup file at floor are;
After reboot pc, gillsonic outputs are;
Tower flux system: Fence working, flux system was running good during last week. PV reading 13.5V, 7.9A, and 2.6A battery half full at 11:45am. Download data. The setup file is
Sonic flux program output after I downloading data and reboot PC.
Vaira Ranch: Fence and flux system running good. PV reading 13.6, 6.2 and 2.6A. Battery half full. Setup file is:
Soil moisture probe reading see above. Gillsonic outputs after download the data and reboot pc
Sonic N is facing W. I guess we need measure the orientation, then need correct it. | ||||||||||||||||||||||||||||||||||||||||||||||||||||||||||||||||||||||||||||||||||||||||||||||||||||||||||||||||||||||||||||||||||||||||||||||||||||||||||||||||||||||||||||||||||||||||
0 photos found
16 sets found
No data found for TZ_Fenergy.
11 TZ_tmet graphs found
No data found for TZ_soilco2.
Can't check TZ_mixed
3 TZ_mixed graphs found
No data found for TZ_fflux.
8 TZ_fmet graphs found
No data found for TZ_tram.
No data found for TZ_co2prof.
No data found for TZ_irt.
No data found for TZ_windprof.
No data found for TZ_tflux.
2 TZ_sm graphs found
Can't check TZ_met
1 TZ_met graphs found
Can't check TZVR_mixed
No data found for TZ_osu.
No data found for TZ_fd.