Field Notes
<--2020-09-01 11:30:00 | 2020-09-29 10:00:00-->Other sites visited today: Vaira
Phenocam link: Searching...
Tonzi: 2020-09-16 09:30:00 (DOY 260)
Author: Joe Verfaillie
Others:
Summary: Forgot laptop - minimal data download, big tree fell, power strips at tower top, checked floor battery water levels, reset dedrometers
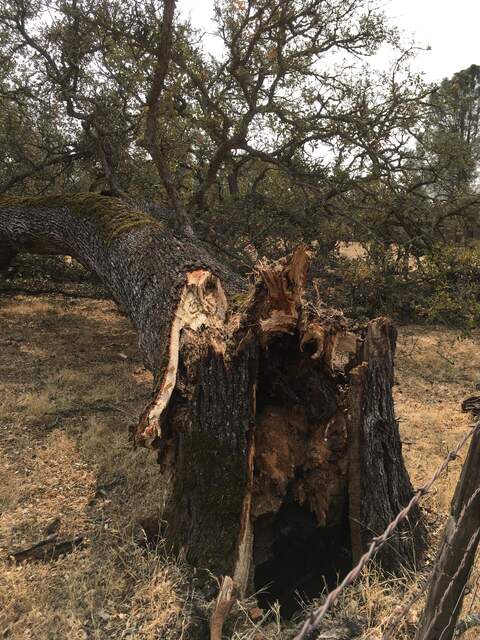
| Tonzi 2020-09-16 I arrived at about 9:30. The air was hazy with wild fire smoke and the sunlight was yellowish. The AQI was supposed to be in the moderate (50-100) range but it seemed kind of spotty. I could see Rancho Seco once from the tower but then later I couldn’t. There was a nice breeze mostly from the west but swinging south for a bit. The trees have lost most of their dead leaves and look a bit greener but there are a lot of leaves on the ground and few leaves left on the trees. The big tree by the fence to the east near the cow water station has fallen over. I forgot to bring the laptop today so I could not download data. I was able to collect the data from the tower computer by moving it to the USB stick that usually collects the FLIR images. Since the FLIR is out for repair I could bring that USB stick home. I did my best to check to make sure everything had power and seemed to be collecting data. The Ethernet on the tower was not working initially. I went up the tower and cleaned up the power distribution at the top. I added an orange pluggable power strip for the 24V lines and a green power strip for the 12V lines. There are a few free 24V plugs but I used all 10 of the 12V plugs. Five of the 12V plugs were used for the SRS sensors. The Ethernet switch is now on the 12V strip instead of the CR1000 – hopefully this will fix the network issues. The network was running afterwards. I cleaned the 7500 but the values didn’t change much. I cleaned the radiometers. There was a little fine ash/dust more dirty bird feet on the incoming SRS sensors. I cleaned the Floor 7500 too. I checked the water in the Floor batteries sn BB-TF. These were low and the four batteries took about three gallons of DI water. I also checked the soil co2 battery bank sn BB-TZ_soilco2 but these batteries are almost brand new and their water levels were fine. I spliced the SHF and PPT wires on the OSU SP1 system that had been chewed through. I removed the screw terminals and soldered on new leads. I reset dendrometers on trees 1, 2 and 79. I measured the well depths and cleaned the z-cam windows. I left at about 13:30 |
Field Data
No tank data
Well Depth
| Date | Location | Depth (feet) |
|---|---|---|
| 2020-09-16 | TZ_road | 38.1 |
| 2020-09-16 | TZ_floor | 30.35 |
| 2020-09-16 | TZ_tower | 33.85 |
| 2020-09-16 | VR_well | 58.85 |
No TZ Moisture Point data found
No VR Moisture Point data found
No TZ grass heigth found
No VR grass heigth found
Tree DBH
| Date | Tag# | Reading (mm) |
|---|---|---|
| 2020-09-16 | 1 | 24.9 |
| 2020-09-16 | 1 | 6.1 |
| 2020-09-16 | 102 | 2.5 |
| 2020-09-16 | 2 | 22.7 |
| 2020-09-16 | 2 | 4.8 |
| 2020-09-16 | 245 | 11.4 |
| 2020-09-16 | 3 | 15.1 |
| 2020-09-16 | 4 | 8.8 |
| 2020-09-16 | 5 | 4.5 |
| 2020-09-16 | 6 | 15.7 |
| 2020-09-16 | 7 | 19.0 |
| 2020-09-16 | 73 | 8.8 |
| 2020-09-16 | 79 | 19.3 |
| 2020-09-16 | 79 | 5.3 |
No water potential data found
No TZ Grass Biomass data found
No TZ OakLeaves Biomass data found
No TZ PineNeedles Biomass data found
1 photos found

20200916TZ_BigTreeFell.jpg ( 2020-09-16 00:00:00 ) Full size: 1440x1920
The big tree by the fence to the east broke off at the base and fell over.
16 sets found
No data found for TZ_Fenergy.
11 TZ_tmet graphs found
11 TZ_soilco2 graphs found
Can't check TZ_mixed
3 TZ_mixed graphs found
1 TZ_fflux graphs found
8 TZ_fmet graphs found
No data found for TZ_tram.
3 TZ_co2prof graphs found
1 TZ_irt graphs found
No data found for TZ_windprof.
1 TZ_tflux graphs found
2 TZ_sm graphs found
Can't check TZ_met
1 TZ_met graphs found
Can't check TZVR_mixed
8 TZ_osu graphs found
3 TZ_fd graphs found
Tonzi Z-cam data

