Field Notes
<--2010-04-15 09:30:00 | 2010-04-22 07:30:00-->Phenocam link: Searching...
Sherman Island: 2010-04-21 10:00:00 (DOY 111)
Author: Joe Verfaillie
Others:
Summary: Batteries ran out, trailer dead, Got images from plantcam.
| Sherman
4/21/2010 Arrived about 10am. Cold, wind from the west, light to moderate rain. Steady rain continued until about 2pm then became patchy and light. Wind died as rain ended. Sonic data looked okay so rain maybe not heavy enough to loose winds. Trailer was dead – batteries ran out. Started up on the generator. LGR initial readings 9:33PST, 10.86C, 139.35Torr, 18.418usec, 1.9301ppm, 9550.10ppm, 407.40ppm, 10Hz Calibrated LGR 1.976ppm CH4 tank 700psi Precal: 9:35PST, 138.11Torr, 1.989+- 0.003ppm CH4 PostcalL: 9:38PST, 138.09Torr, 1.978+-0.004ppm CH4 Accidentally left recording at 1Hz until next day at midday. Got images from the plantcam – can see progression of the tide. Went to Pasture site where Picarro was setting up. They have a small tent to the south east of the box inside the cow fence. Their equipment is hung on the tower at about the horizontal top bars and over the line of the cow fence. So lower and south east of our flux sensors and just north of our radiation sensors. Picarro is using the spare 20A power line I set up for the LGR trailer. They have two pumps a big one with big diameter tubing (~2inch) pulling high flow from the tower then a smaller pump pull a sub-sample from the high flow to feed to their analyzer. They also have and open-path LI7500, Gill WMP sonic and Vaisala HMP45 on the tower and a second enclosed LI7500 in the high flow line inside the tent. They will run a week or some depending on the data. I swapped out our single channel LGR sn 08-0114 out because of low pressure in low flow and low ringtime <11usec. Our other analyzer fresh from factory repair was swapped in sn 05-0012(?). I checked the cal on the new analyzer with 1.976ppm CH4 tank: 12:01PDT, 16.19C, 156.13Torr, 18.587usec, 1.976ppm CH4 Clock is 2 hours ahead of PST, pressure seems high, but calibration is right on, so I did not calibrate. LGR readings in high flow: 12:07PDT, 16.34C, 143.80Torr, 18.591usec, 1.852ppm CH4, 10Hz, 1119.0hrs Returned to trailer and shutdown generator. Batteries were still taking power, but probably enough to run overnight. |
10 photos found
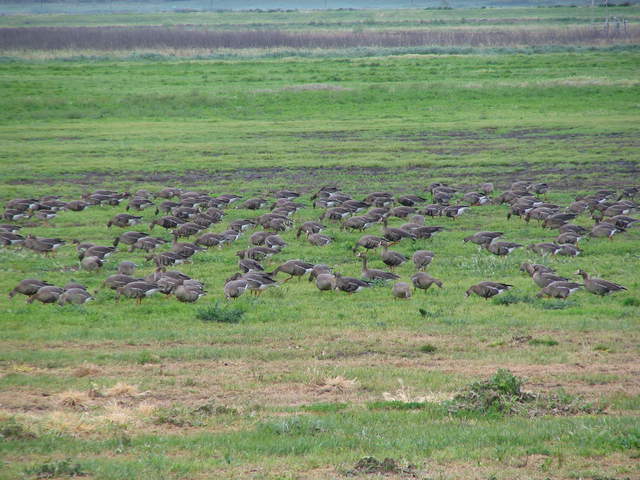
20100421SI_Geese1.jpg ( 2010-04-21 09:50:36 ) Full size: 2048x1536
Greater white fronted geese on field
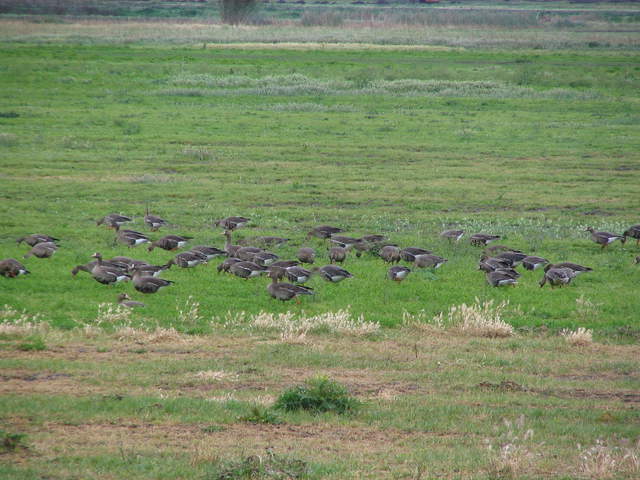
20100421SI_Geese2.jpg ( 2010-04-21 09:50:43 ) Full size: 2048x1536
Greater white fronted geese on field
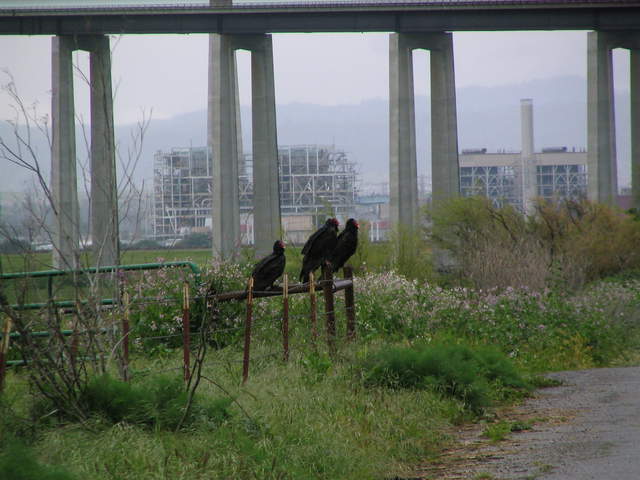
20100421SI_TurkeyVultures1.jpg ( 2010-04-21 09:56:18 ) Full size: 2048x1536
Turkey vultures on fence
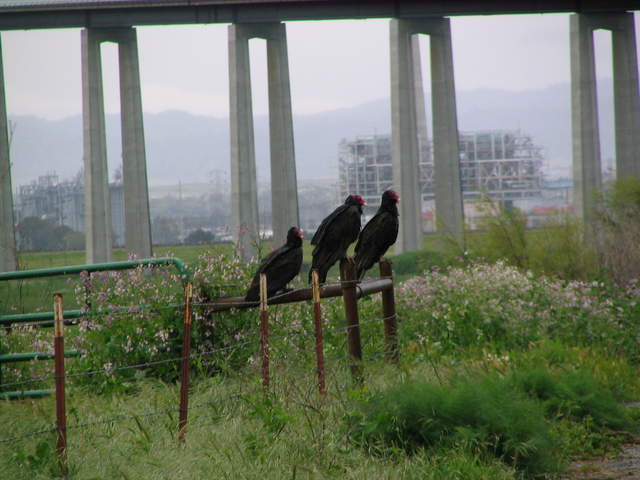
20100421SI_TurkeyVultures2.jpg ( 2010-04-21 09:56:33 ) Full size: 2048x1536
Turkey vultures on fence closer
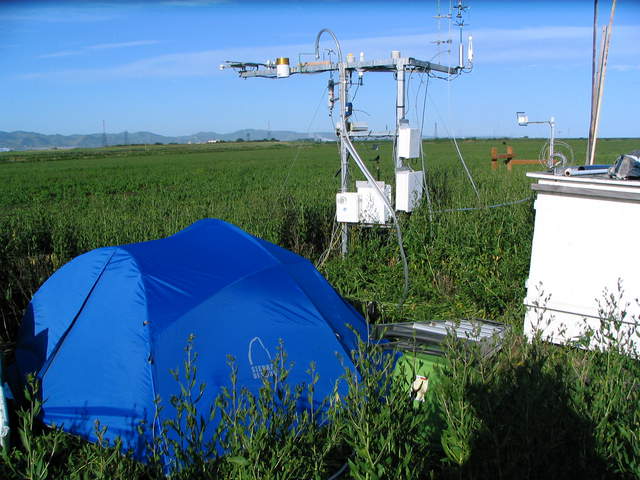
20100422SI_PicarroSetup1.jpg ( 2010-04-22 08:09:05 ) Full size: 2048x1536
Picarro tent at the Sherman site
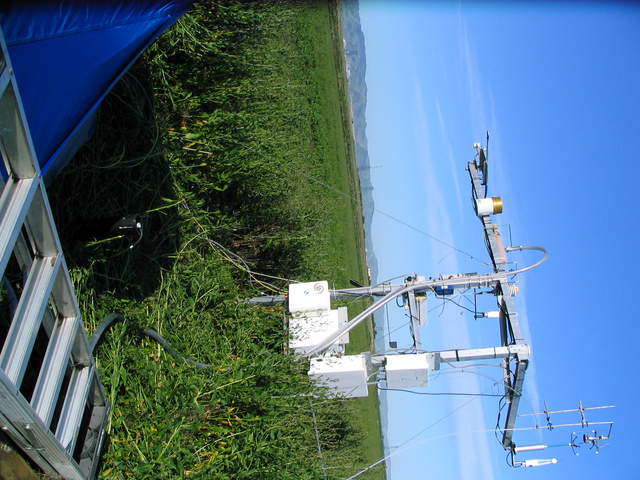
20100422SI_PicarroSetup2.jpg ( 2010-04-22 08:09:13 ) Full size: 2048x1536
Sherman eddy tower with Picarro experiement
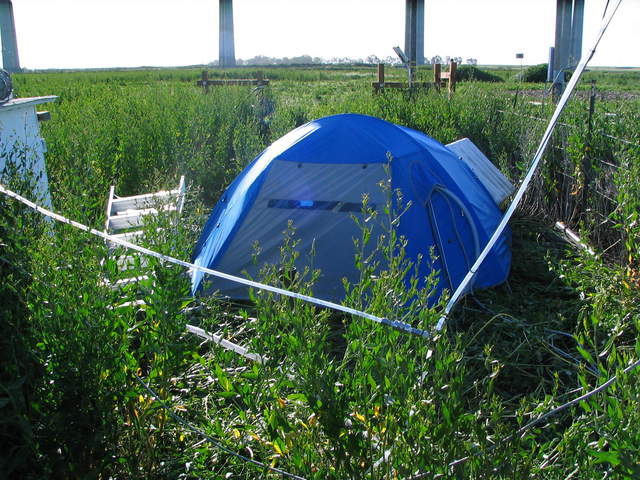
20100422SI_PicarroSetup3.jpg ( 2010-04-22 08:09:25 ) Full size: 2048x1536
Picarro tent at the Sherman site
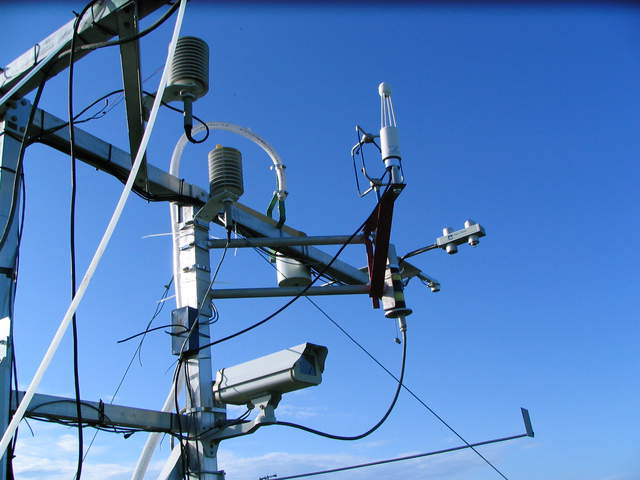
20100422SI_PicarroSetup4.jpg ( 2010-04-22 08:09:32 ) Full size: 2048x1536
Picarro inlets near eddy sensors
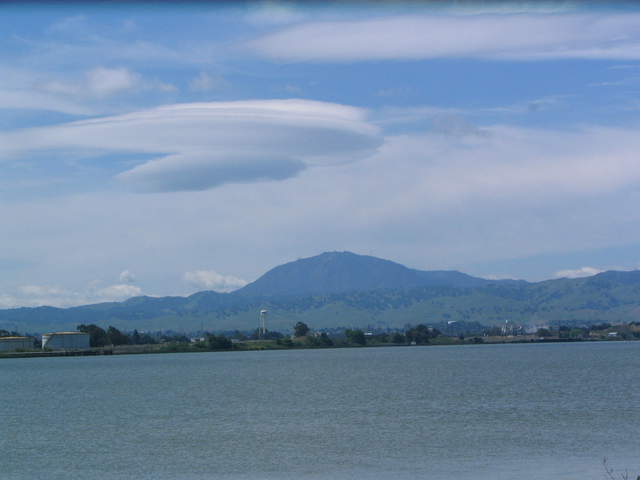
20100422SI_DiabloClouds1.jpg ( 2010-04-22 12:03:04 ) Full size: 2048x1536
View of Mt Diablo across the river lenticular clouds
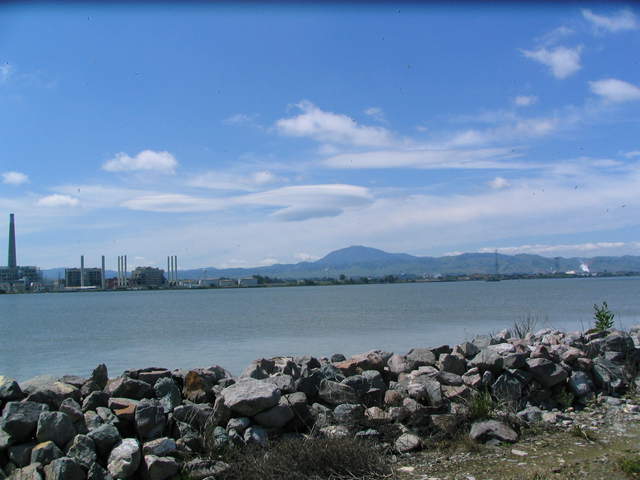
20100422SI_DiabloClouds2.jpg ( 2010-04-22 12:03:11 ) Full size: 2048x1536
Long view of Mt Diablo across the river lenticular clouds
7 sets found
No data found for SI_mp.
11 SI_met graphs found
Can't check SI_mixed
2 SI_mixed graphs found
No data found for SI_flx.
2 SI_soilco2 graphs found
Can't check TWSI_mixed
Can't check SIMBTWEE_met

