Field Notes
<--2020-08-05 09:25:00 | 2020-09-01 15:05:00-->Other sites visited today: East End | Bouldin Corn | Bouldin Alfalfa
Phenocam link: Searching...
West Pond: 2020-08-21 09:05:00 (DOY 234)
Author: Ariane Arias-Ortiz
Others: Daphne, Christiana
Summary: Regular data download and porewater sampling, boards were put back at the outlets, installed miniDOT, swapped 7500 for calibration
| Daphne, Christiana and I arrived at West Pond at 9:05 PDT. The air quality was bad, lots of smoke from the wildfires. There was a little breeze and we could still hear the birds. The water level was below the staff gauge (the mud was at 18-19 cm). The wetland was dry with no standing water, Ariane installed the boards at the riser weirs with the aim of flooding the wetland again the week of the 24 - 28, August. Porewaters were found below -20 cm. Daphne downloaded met, cam, and USB GHG data. She swapped the LI-7500A for calibration: sn 0041 came off and sn 75H-2150 went on. She updated the configuration file, changed the pressure coefficient, and reset the box. She cleaned flux and rad sensors, topped off the wash reservoir, and swapped the water level desiccant. She also installed a new miniDOT (sn 180871), which is hanging in air between the wooden deck and the east side of the tower. LI-7500 readings (sn 0041 --> sn 0041 after cleaning --> sn 75H-2150): CO2 410ppm --> 414 --> 414 H2O 750ppm --> 730 --> 759 T 21.1C --> 21.7 --> 22.6 P 101.1kPa --> 101.1 --> 101.1 SS 97--> 100 --> 100 LI7700 readings: CH4 2.05ppm RSSI 58 ->74 after cleaning She left at 9:45 PDT but came back briefly at 11:25 PDT to clean the conductivity sensor, which had a little mud but nothing too notable. I sampled porewaters at the tower and at the 0.5 footprint as part of the dry/rewetting experiment at West Pond started in July. The water level has gone down by at least 20 cm since last sampling day (July 31st). The sippers at -10 and -20 cm were dry, therefore porewaters were sampled at -30 and -50 cm at the tower and at -30, -40, -50 and -60 cm at the 0.5 footprint site. Conductivity, salinity and pH values were similar among sites and depths, no clear patterns observed. Average porewater values at the Tower Conductivity: 362 uS Salinity: 0.20 ppt pH: 6.12 T: 18.7 C DO: 0.8% (0.08 mg/l) I left at 11:20 PDT |
1 photos found

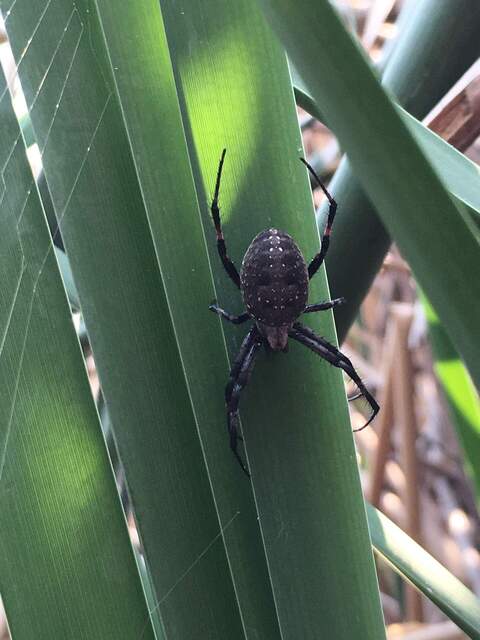
20200821WP_Spider.jpg ( 2020-08-21 11:44:34 ) Full size: 1440x1920
Western spotted orbweaver spider by the WP boardwalk. This spider was identified by an app in less than 1 second.
8 sets found
Can't check WP_DO
1 WP_DO graphs found
14 WP_met graphs found
5 WP_flux graphs found
Can't check MBWPEESWGT_mixed
Can't check MBEEWPSWEPGT_cam
Can't check MBSWEEWPBCBA
1 WP_processed graphs found
No data found for WP_arable.

