
Field Notes
<--2020-06-12 10:30:00 | 2020-07-07 10:00:00-->Other sites visited today: Vaira | Tonzi
Phenocam link: Searching...
Tonzi: 2020-06-12 12:00:00 (DOY 164)
Author: Joe Verfaillie
Others: Hisashi, Kyoko, Siyan
Summary: Grass is mostly dead, fire to the northeast, replaced z-cam clock batteries and reset clocks, tree circumference for DBH trees
| Tonzi 2020-06-12 Hisashi, Kyoko, Siyan and I arrive at 12:00. It was a mild day with a strong gusty wind from the east southeast. We could see a fire burning to the northeast and three firefighting aircraft flew over. The fire was near Grant Line Road and Kiefer Boulevard and was 5000+ acres. The trees look good but the grass is near completely dead. The pond is about half full and no cows were seen. On the way home we got into a bit of rain near Davis. I checked on the LattePanda computer and it seems fine with the external USB hub. I brought a powered USB hub just in case but adding more components to the system doesn’t seem warranted at this time. I collected the eddy data, the FD chamber data (did not clear it), and the data loggers not connected by radio. The CR1000 tree IRT had not sent data since last visit. I downloaded it directly. It probably needs an antenna extension to get the antenna away from the metal box. The Tower 7500 read: 406.8ppm CO2, 470.4mmol/m3 H2O, 21.5C, 99.4kPa, 99.1SS The Floor 7500 read: 410.3ppm CO2, 435.0mmol/m3 H2O, 24.5V, 99.2kPa, 99.1SS Siyan did DBH, well measurements and midday water potential. I serviced the z-cams. Cam 1’s clock battery had died last time. I replaced the old battery which still had a voltage of 3.08V with a new one and set its clock to PST. I replaced the batteries in the other two cameras just in case: Cam 2: battery was 3.06V, its clock was set to PDT, I reset it to PST Cam 3: battery was 3.07V, its clock was set to PDT, I reset it to PST I also measured the circumference of the DBH trees in cm by putting a tape around them just above the DBH band. On a larger tree a difference of more than 1cm could occur depending on how I placed the band. Also on trees larger than 100cm I had to measure the circumference in two parts. Tree, circumference (cm) 245, 54 102, 83 79, 107.5 72, 106 1, 107.8 7, 89.5 4, 80 5, 41.7 6, 53 2, 125.5 3, 111 We left at about 14:30 |
Field Data
No tank data
Well Depth
| Date | Location | Depth (feet) |
|---|---|---|
| 2020-06-12 | VR_well | 55.3 |
| 2020-06-12 | TZ_floor | 27 |
| 2020-06-12 | TZ_tower | 31.6 |
| 2020-06-12 | TZ_road | 36 |
| 2020-06-12 | VR_pond | 17.56 |
mode = both
Moisture Point Probes TZ
Array
(
[0] => Tower_1
[1] => Floor_South_1
[2] => Soil_Transect_4_1
[3] => Soil_Transect_3_1
[4] => Soil_Transect_2_1
[5] => Soil_Transect_1_1
[6] => SoilCO2_West_A_1
[7] => SoilCO2_West_B_1
[8] => SoilCO2_West_C_1
[9] => Tower_2
[10] => Floor_South_2
[11] => Soil_Transect_4_2
[12] => Soil_Transect_3_2
[13] => Soil_Transect_2_2
[14] => Soil_Transect_1_2
[15] => SoilCO2_West_A_2
[16] => SoilCO2_West_B_2
[17] => SoilCO2_West_C_2
[18] => Tower_3
[19] => Floor_South_3
[20] => Soil_Transect_4_3
[21] => Soil_Transect_3_3
[22] => Soil_Transect_2_3
[23] => Soil_Transect_1_3
[24] => SoilCO2_West_A_3
[25] => SoilCO2_West_B_3
[26] => SoilCO2_West_C_3
[27] => Tower_4
[28] => Floor_South_4
[29] => Soil_Transect_4_4
[30] => Soil_Transect_3_4
[31] => Soil_Transect_2_4
[32] => SoilCO2_West_A_4
[33] => SoilCO2_West_B_4
[34] => SoilCO2_West_C_4
)
| Date | DOY | Rep | Depth | Tower_1 |
Floor_South_1 |
Soil_Transect_4_1 |
Soil_Transect_3_1 |
Soil_Transect_2_1 |
Soil_Transect_1_1 |
SoilCO2_West_A_1 |
SoilCO2_West_B_1 |
SoilCO2_West_C_1 |
Tower_2 |
Floor_South_2 |
Soil_Transect_4_2 |
Soil_Transect_3_2 |
Soil_Transect_2_2 |
Soil_Transect_1_2 |
SoilCO2_West_A_2 |
SoilCO2_West_B_2 |
SoilCO2_West_C_2 |
Tower_3 |
Floor_South_3 |
Soil_Transect_4_3 |
Soil_Transect_3_3 |
Soil_Transect_2_3 |
Soil_Transect_1_3 |
SoilCO2_West_A_3 |
SoilCO2_West_B_3 |
SoilCO2_West_C_3 |
Tower_4 |
Floor_South_4 |
Soil_Transect_4_4 |
Soil_Transect_3_4 |
Soil_Transect_2_4 |
SoilCO2_West_A_4 |
SoilCO2_West_B_4 |
SoilCO2_West_C_4 |
Avg | Spacial Count |
Measurement Count |
|---|---|---|---|---|---|---|---|---|---|---|---|---|---|---|---|---|---|---|---|---|---|---|---|---|---|---|---|---|---|---|---|---|---|---|---|---|---|---|---|---|---|
| 2020-06-12 | 164 | 0 | nan | 5.3 | 6.6 | 2.4 | 9.4 | 3.7 | 0.3 | 9.7 | 5.9 | 4.7 | 11.2 | 11.8 | 9 | 15.8 | 21.9 | 5.1 | 14.8 | 6 | 13.6 | 15.6 | 15.4 | 11.5 | 16.5 | 29.3 | 14.1 | 20.1 | 17 | 12.6 | 20.2 | 7.3 | 12.5 | 21.6 | 27.4 | 17 | 23.4 | 20.5 | |||
| 2020-06-12 | 164 | 1 | nan | 5.3 | 1.5 | 2.1 | 8.8 | 1.9 | 0.3 | 8.3 | 5.3 | 5 | 12.1 | 11.2 | 9 | 15.5 | 19.1 | 4.8 | 12.4 | 4.5 | 13 | 15.6 | 16.5 | 10.6 | 16.5 | 25.4 | 14.3 | 20.1 | 15.6 | 12.6 | 19.9 | 7.3 | 13 | 21.9 | 27.6 | 17.6 | 23.4 | 19.6 | |||
| 2020-06-12 | 164 | Avg | 0-15cm | 0 | 0 | ||||||||||||||||||||||||||||||||||||
| 2020-06-12 | 164 | Avg | 15-30cm | 0 | 0 | ||||||||||||||||||||||||||||||||||||
| 2020-06-12 | 164 | Avg | 30-45cm | 0 | 0 | ||||||||||||||||||||||||||||||||||||
| 2020-06-12 | 164 | Avg | 45-60cm | 0 | 0 |
mode = both
Moisture Point Probes VR
Array
(
[0] => Flux_Tower_1
[1] => Biomass_Cage_1
[2] => Flux_Tower_2
[3] => Biomass_Cage_2
[4] => Flux_Tower_3
[5] => Biomass_Cage_3
[6] => Flux_Tower_4
[7] => Biomass_Cage_4
)
| Date | DOY | Rep | Depth | Flux_Tower_1 |
Biomass_Cage_1 |
Flux_Tower_2 |
Biomass_Cage_2 |
Flux_Tower_3 |
Biomass_Cage_3 |
Flux_Tower_4 |
Biomass_Cage_4 |
Avg | Spacial Count |
Measurement Count |
|---|---|---|---|---|---|---|---|---|---|---|---|---|---|---|
| 2020-06-12 | 164 | 0 | nan | 1.2 | 0.6 | 9.3 | 5.7 | 4.5 | 13.4 | 14.8 | 15.6 | |||
| 2020-06-12 | 164 | 1 | nan | 1.5 | 0.6 | 9.3 | 5.7 | 3.7 | 13.1 | 13.9 | 15.3 | |||
| 2020-06-12 | 164 | 2 | nan | 1.2 | 0.3 | 9.7 | 6 | 3.9 | 14 | 14.2 | 15 | |||
| 2020-06-12 | 164 | 3 | nan | 1.2 | 1.2 | 9 | 5.7 | 4.5 | 14 | 13.6 | 15.6 | |||
| 2020-06-12 | 164 | Avg | 0-15cm | 0 | 0 | |||||||||
| 2020-06-12 | 164 | Avg | 15-30cm | 0 | 0 | |||||||||
| 2020-06-12 | 164 | Avg | 30-45cm | 0 | 0 | |||||||||
| 2020-06-12 | 164 | Avg | 45-60cm | 0 | 0 |
No TZ grass heigth found
No VR grass heigth found
Tree DBH
| Date | Tag# | Reading (mm) |
|---|---|---|
| 2020-06-12 | 1 | 25.2 |
| 2020-06-12 | 102 | 16.3 |
| 2020-06-12 | 2 | 23.0 |
| 2020-06-12 | 245 | 12.6 |
| 2020-06-12 | 3 | 15.4 |
| 2020-06-12 | 4 | 9.0 |
| 2020-06-12 | 6 | 16.0 |
| 2020-06-12 | 7 | 19.2 |
| 2020-06-12 | 72 | 9.4 |
| 2020-06-12 | 79 | 20.6 |
Water Potential - mode: raw
| Time | Species | Tree | readings (bar) | ||
|---|---|---|---|---|---|
| 2020-06-12 13:13:00 | OAK | 102 | -23 | -17 | -27 |
| 2020-06-12 13:13:00 | OAK | 35 | -35 | -34 | -36 |
| 2020-06-12 13:13:00 | OAK | 92 | -31 | -27 | -26 |
| 2020-06-12 13:49:00 | PINE | OLD | -1 | -5 | -4 |
| 2020-06-12 13:49:00 | PINE | YNG | -1 | -5 | -7 |
No TZ Grass Biomass data found
No TZ OakLeaves Biomass data found
No TZ PineNeedles Biomass data found
1 photos found
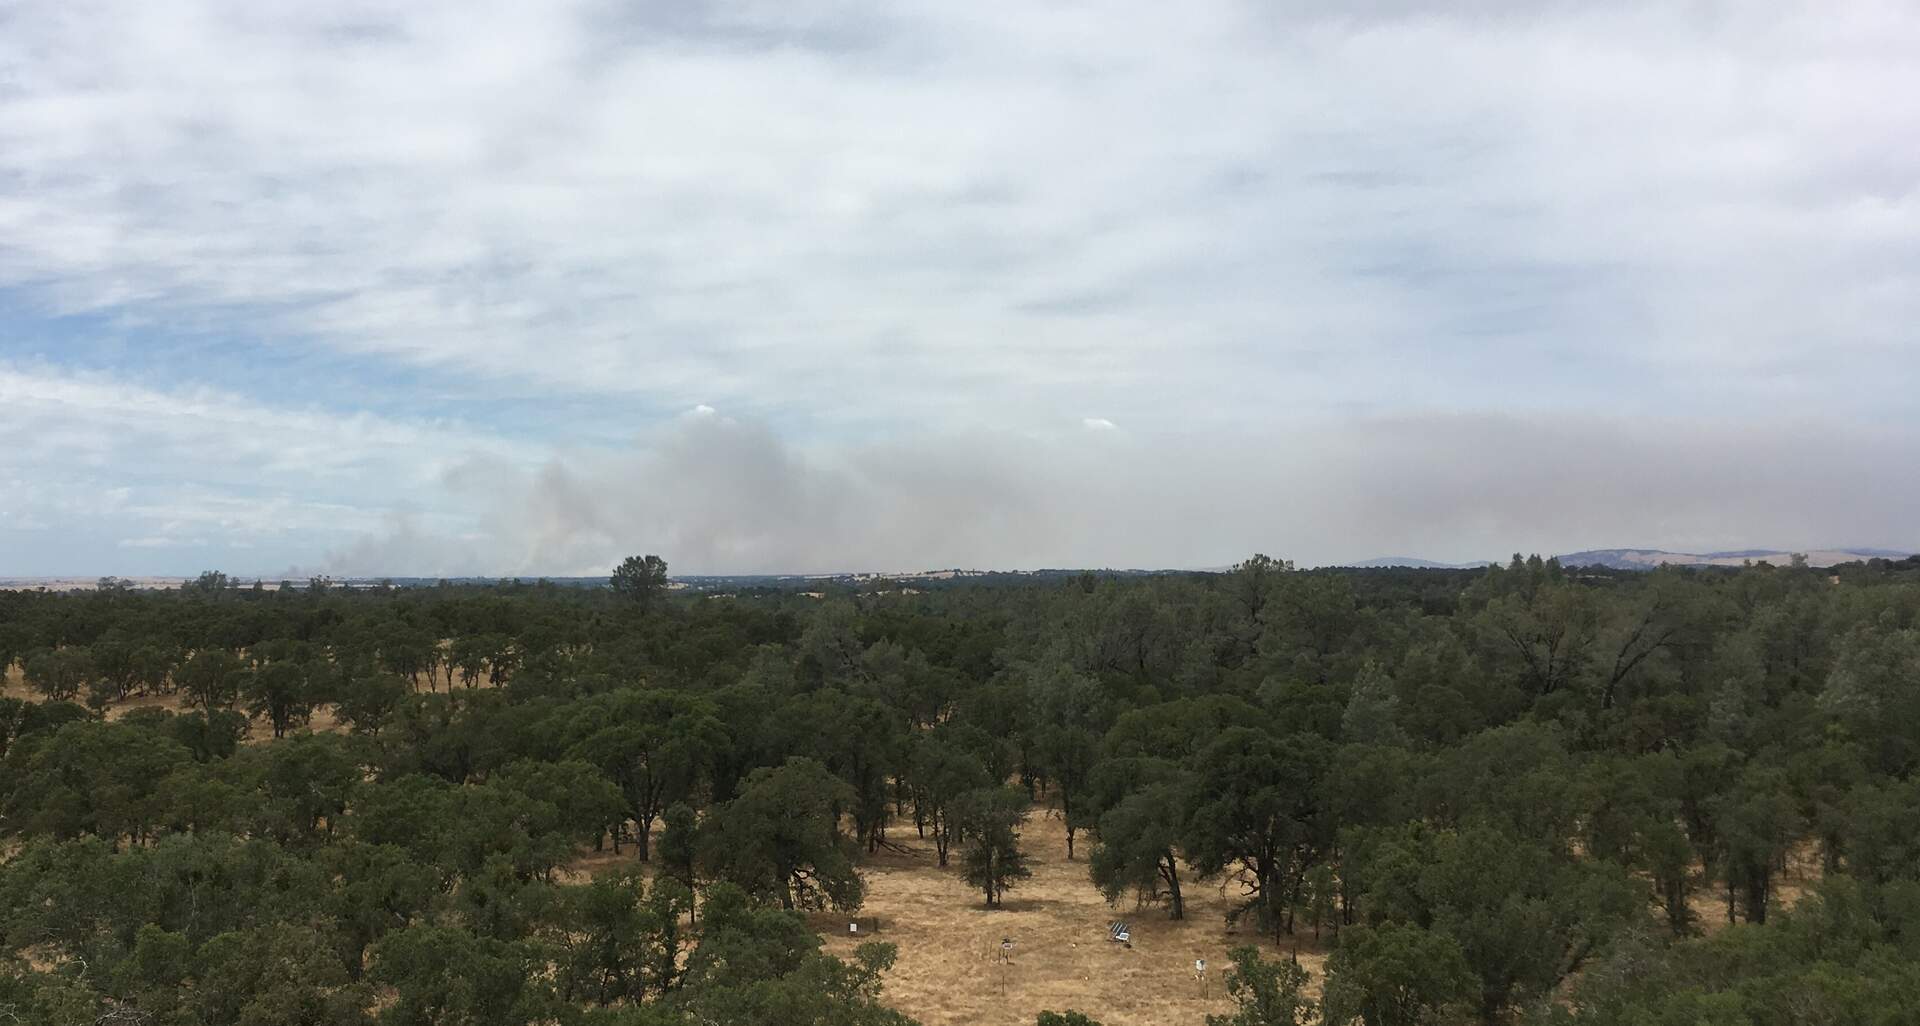
20200612TZ_FireToNE.jpg ( 2020-06-12 00:00:00 ) Full size: 1920x1026
Fire to the northeast on a blustery day
16 sets found
No data found for TZ_Fenergy.
11 TZ_tmet graphs found
11 TZ_soilco2 graphs found
Can't check TZ_mixed
3 TZ_mixed graphs found
1 TZ_fflux graphs found
8 TZ_fmet graphs found
No data found for TZ_tram.
3 TZ_co2prof graphs found
1 TZ_irt graphs found
No data found for TZ_windprof.
1 TZ_tflux graphs found
2 TZ_sm graphs found
Can't check TZ_met
1 TZ_met graphs found
Can't check TZVR_mixed
8 TZ_osu graphs found
3 TZ_fd graphs found
Tonzi Z-cam data