
Field Notes
<--2010-01-27 11:30:00 | 2010-02-10 11:00:00-->Other sites visited today: Tonzi | Vaira
Phenocam link: Searching...
Tonzi: 2010-02-10 10:00:00 (DOY 41)
Author: Siyan Ma
Others: Dennis, Joe
|
When: Date: 2/10/2010 , Day: 41 , Watch Time: 10:00 . Where: Tonzi/Vaira Ranch Who: Siyan, DDB, Joe Weather: nice, partially cloudy day Phenology: green grasses, no oak leaf yet
Summary
Vaira_Grass Site

Tonzi_Tower Site

CO2 1100 psig; flow 20 psi; 431.25 ppm. N2 800 psig; flow 20 psi. Manually calibrate Li-800. Following Ted’s instruction: H:\IoneSavanna_2004\Tower_2004\CO2Profile\LI800_Calibration_Procedure_2Nov04.txt Is the pump running Joe turned off when he visited last time to save power for running EC system. No calibration this time.
Toniz_Floor Site
Reading: Feb. 9, 11:24 am Re-set: Feb. 10, 11:19 am

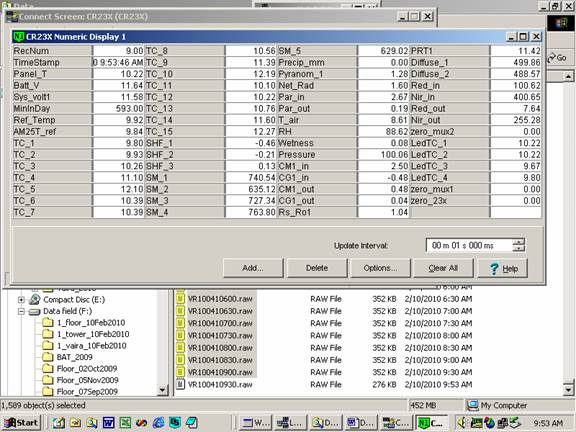
CR23X3 – floor-Met 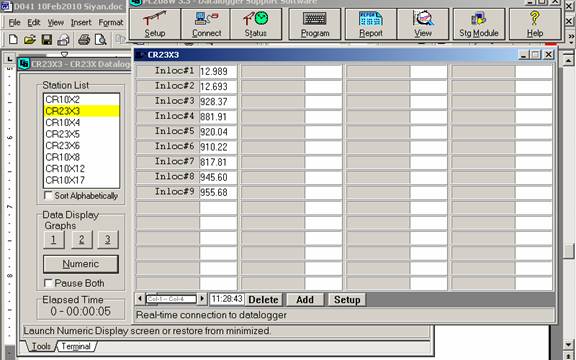
CR23X5 – soil CO2 profile 
CR23X6 – tower-Met 
CR10X2 – floor-Met 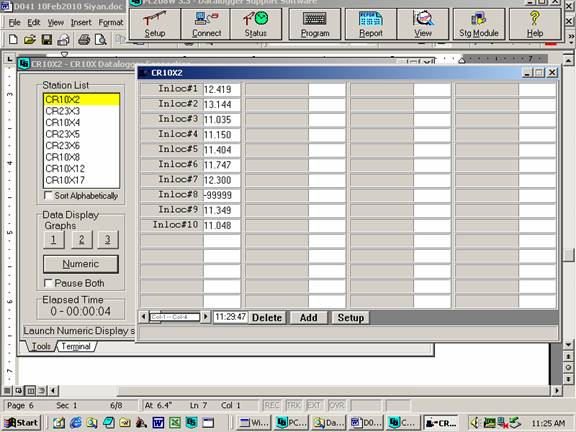
Notes: “X” means not working any more. Dendrometers installed by Gretchen group 
Rename data files because of the PC clock off problem: 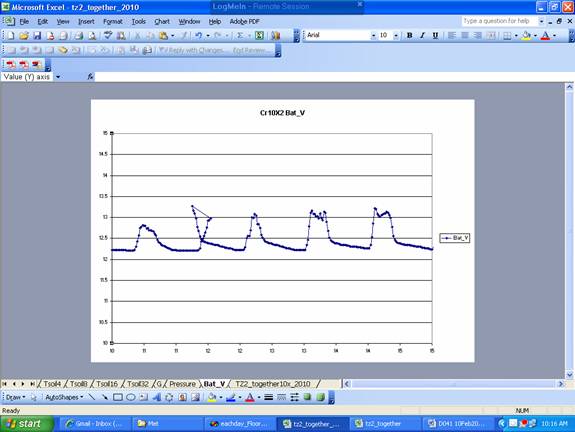

| ||||||||||||||||||||||||||||||||||||||||||||||||||||||||||||||||||||||||||||||||||||||||||||||||||||||||||||||||||||||||||||||||||||||||||||||||||||||||||||||||||||||||||||||||||||||||||||||||||||||||||||||||||||||||||||||||||||||||||||||||||||||||||||||||||||||||||||||||||||||||||||||||||||||||||||||||||||||||||||||||||||||||||||||||||||||||||||||||||||||||||


Field Data
No tank data
Well Depth
| Date | Location | Depth (feet) |
|---|---|---|
| 2010-02-10 | TZ_floor | 28.85 |
| 2010-02-10 | TZ_road | 35.48 |
| 2010-02-10 | TZ_tower | 32.85 |
No TZ Moisture Point data found
No VR Moisture Point data found
No TZ grass heigth found
No VR grass heigth found
No TZ Tree DBH found
No water potential data found
No TZ Grass Biomass data found
No TZ OakLeaves Biomass data found
No TZ PineNeedles Biomass data found
11 photos found
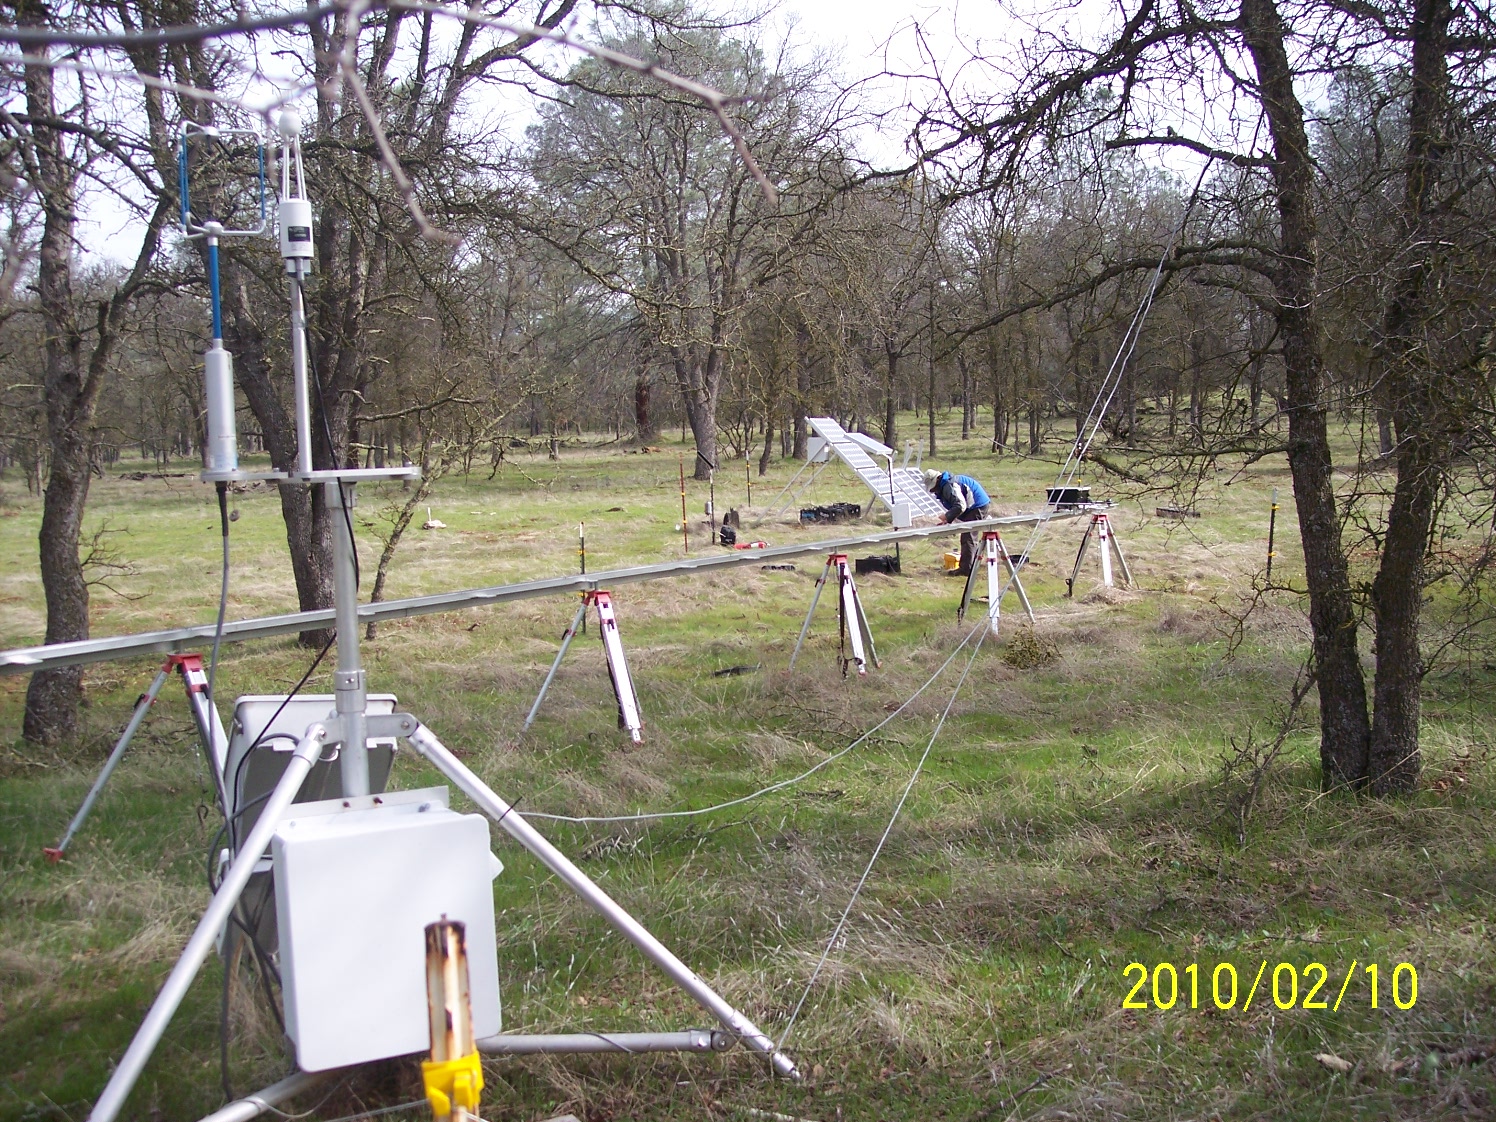
TZ_100_4985.JPG ( 2010-02-10 02:37:32 ) Full size: 1496x1122
Floor eddy tower and Joe working on the tram
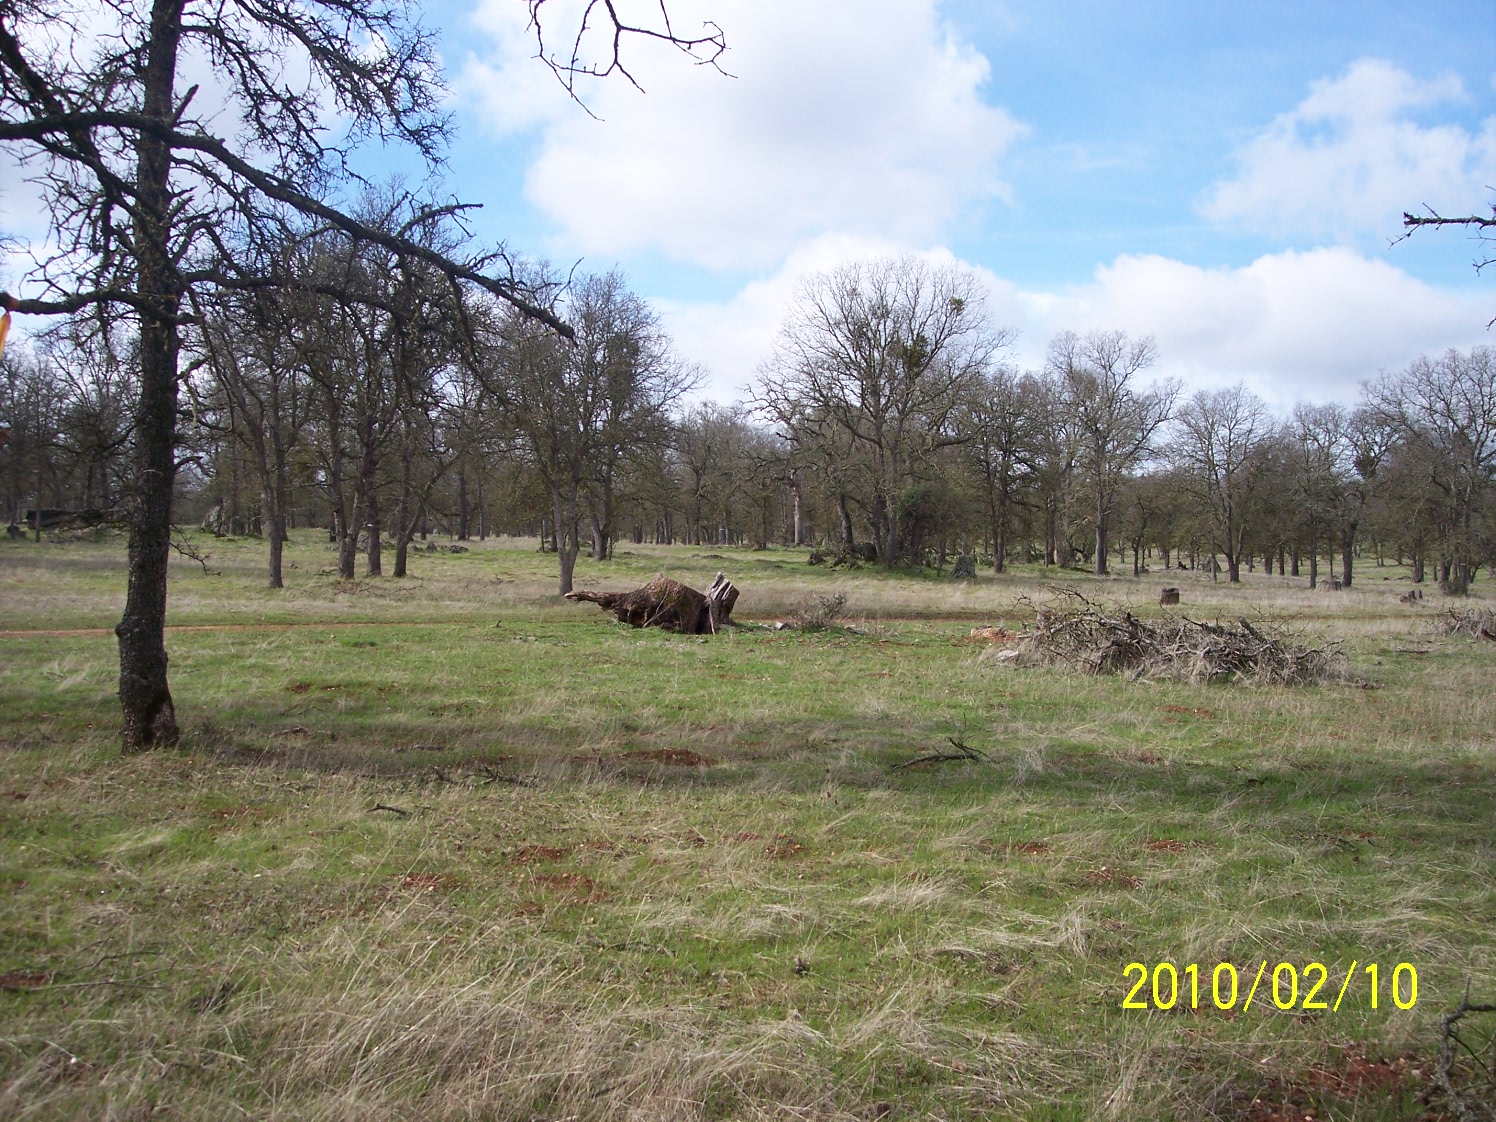
TZ_100_4986.JPG ( 2010-02-10 02:37:42 ) Full size: 1496x1122
Green grass and old stump
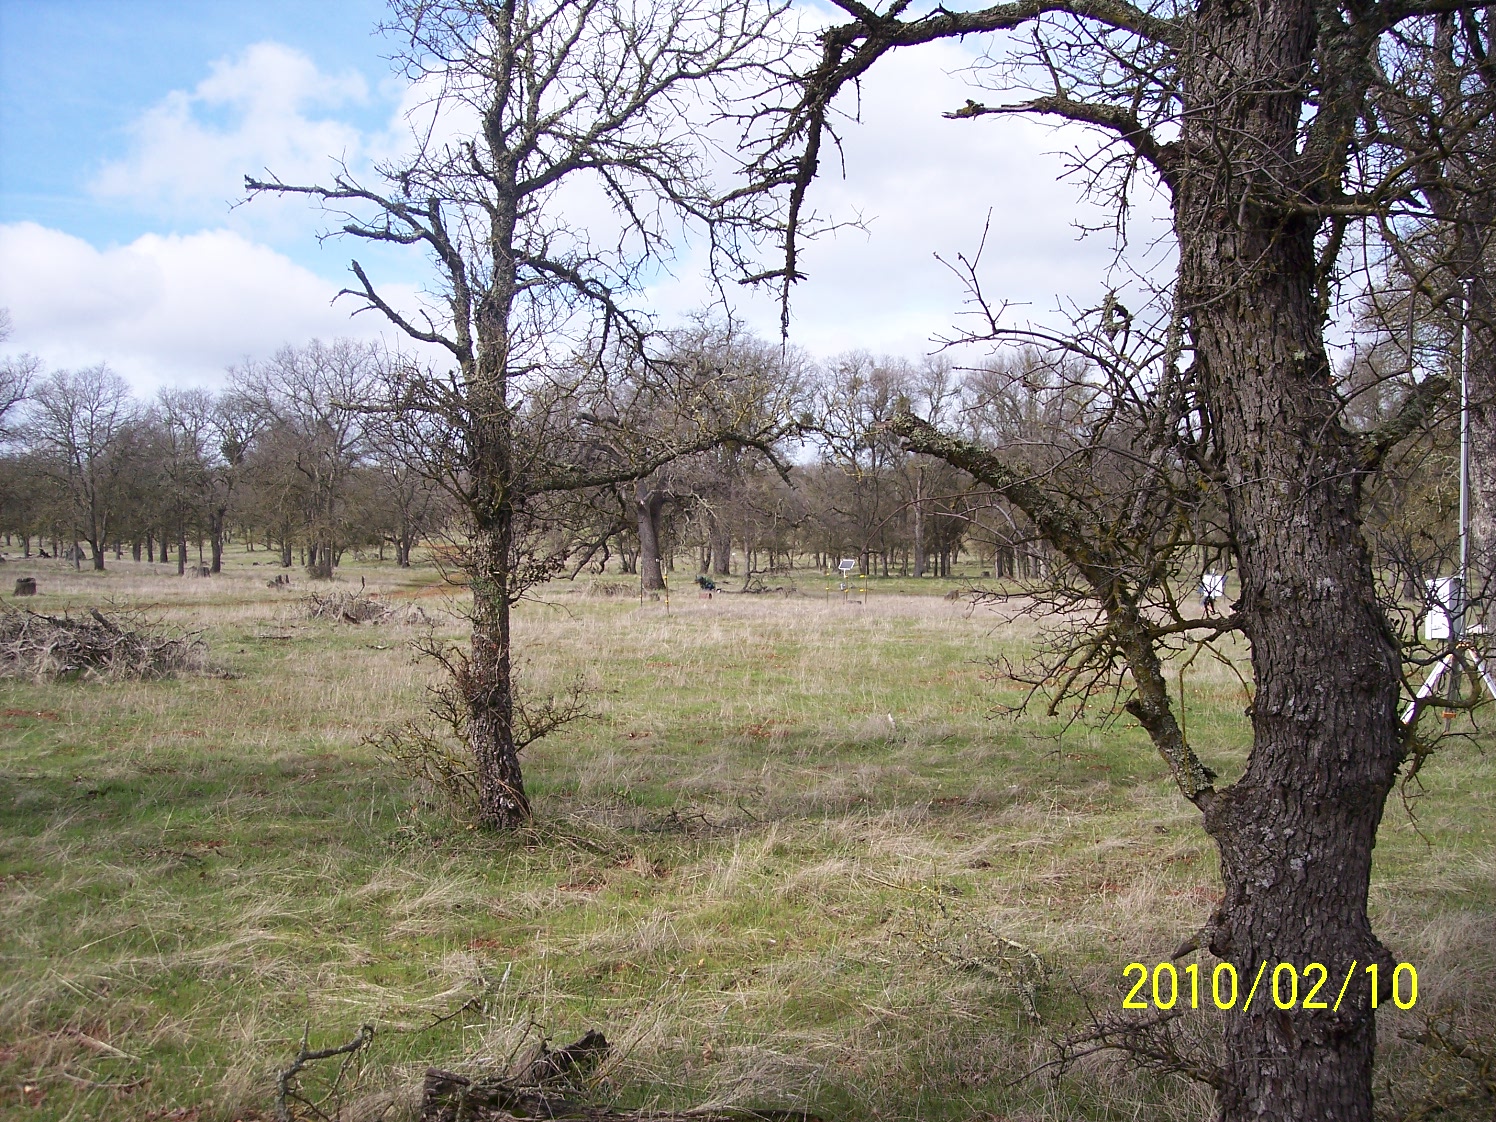
TZ_100_4987.JPG ( 2010-02-10 02:37:52 ) Full size: 1496x1122
Leafless oaks and new grass
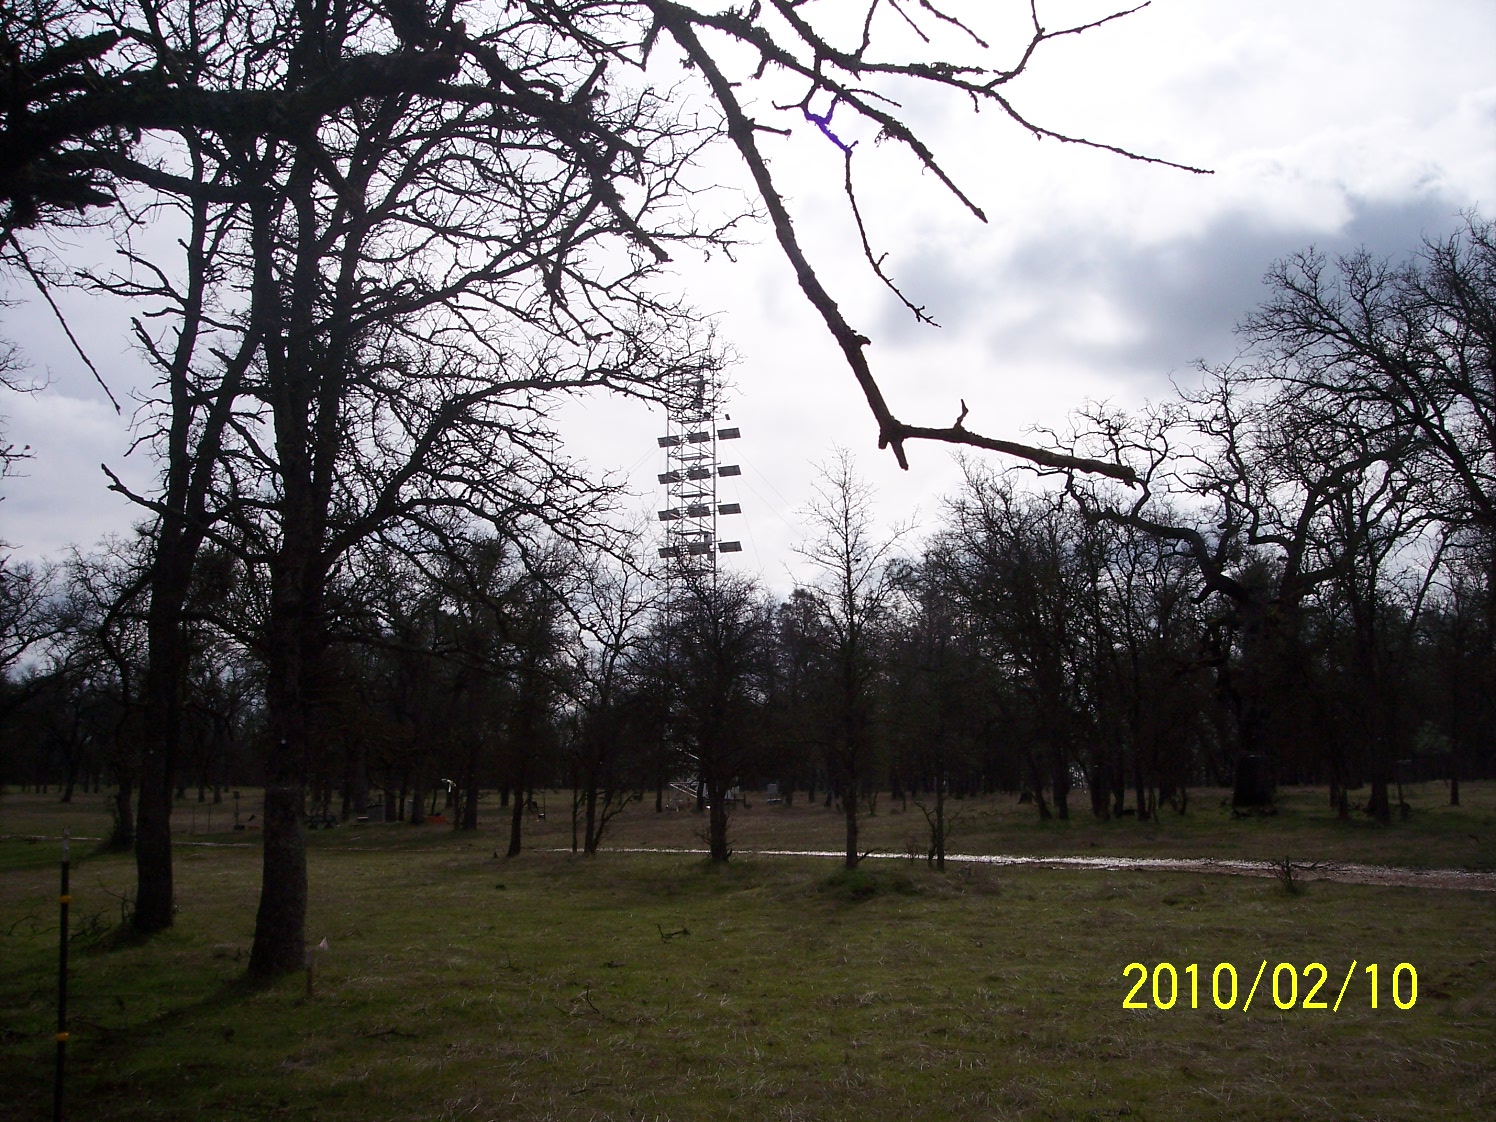
TZ_100_4988.JPG ( 2010-02-10 02:38:14 ) Full size: 1496x1122
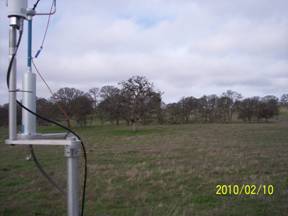
Tonzi tower against cloudy skies
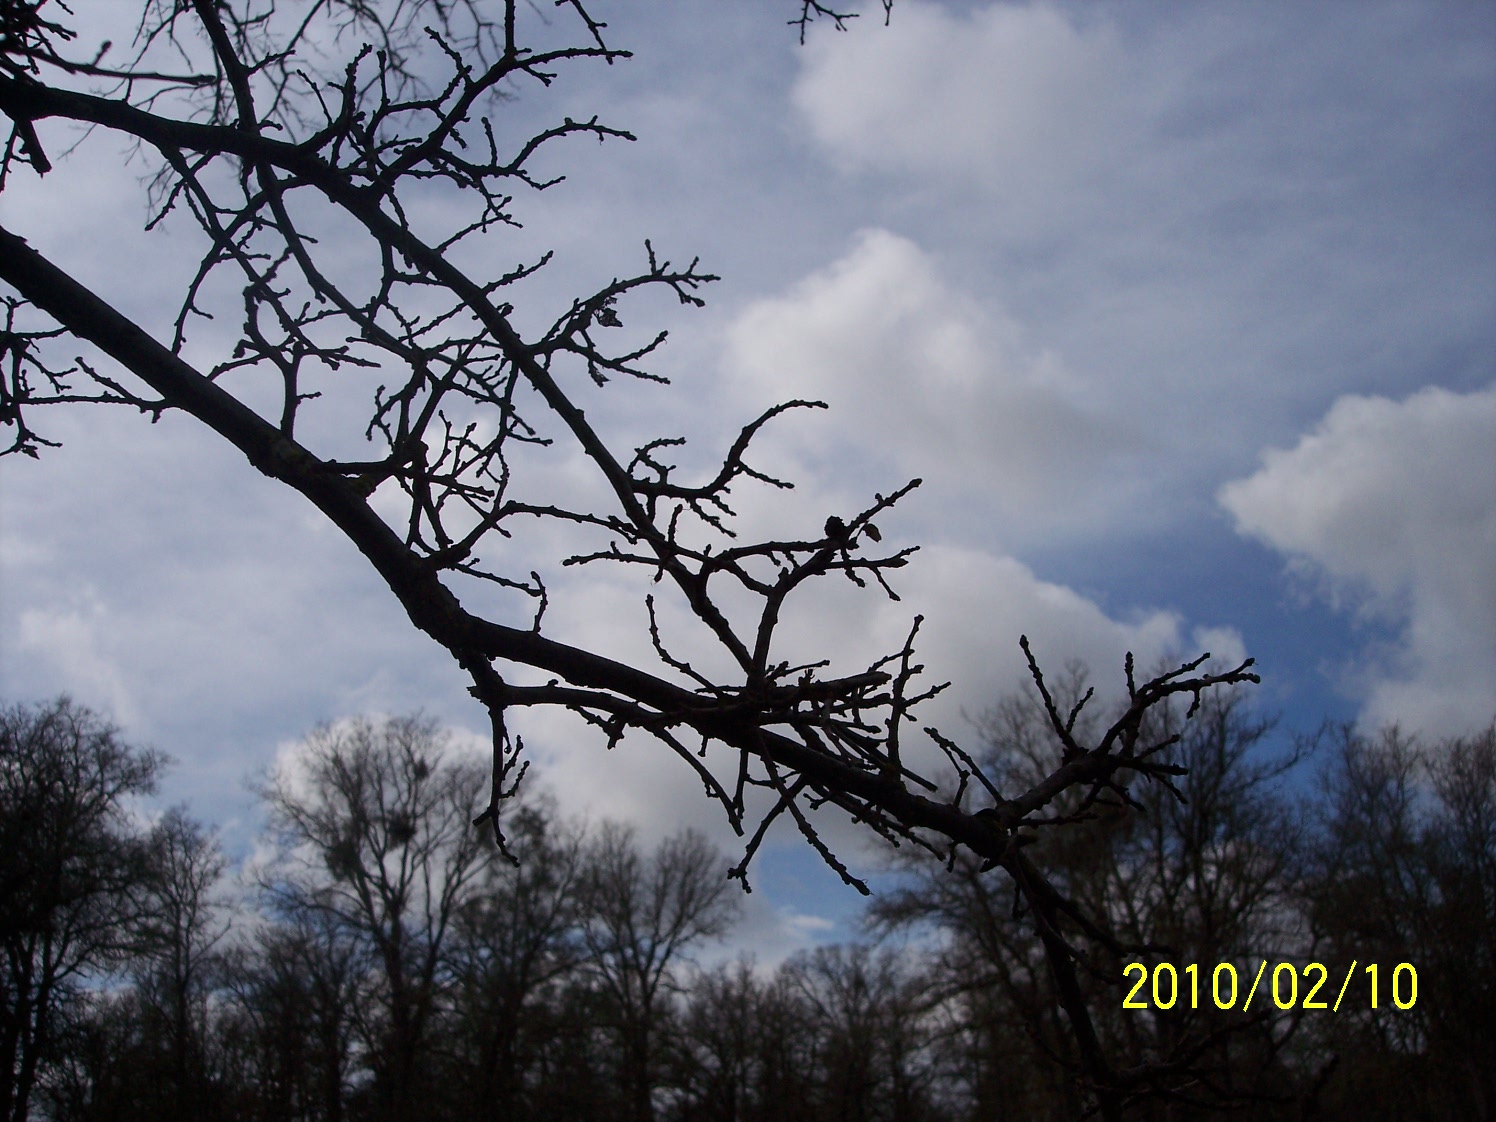
TZ_100_4989.JPG ( 2010-02-10 02:38:32 ) Full size: 1496x1122
Oak twigs against cloudy sky
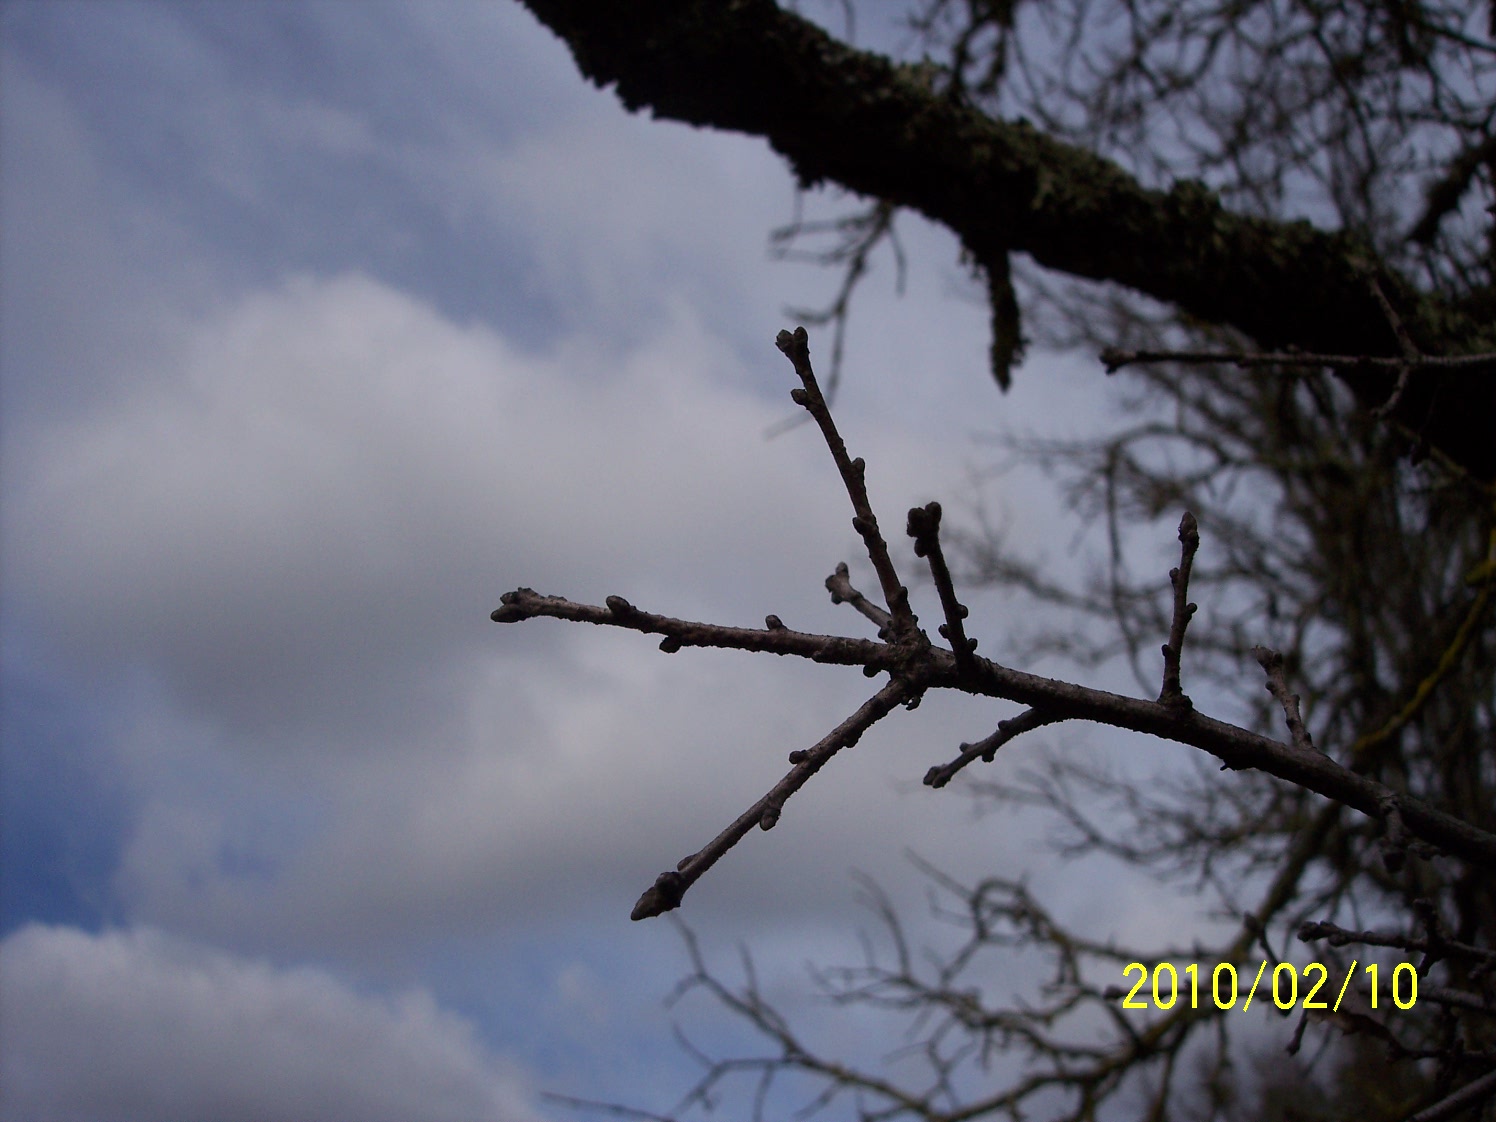
TZ_100_4990.JPG ( 2010-02-10 02:38:50 ) Full size: 1496x1122
Oak twig against cloudy sky

TZ_100_4991.JPG ( 2010-02-10 02:39:04 ) Full size: 1496x1122
Close up of new grass sprouts

TZ_100_4992.JPG ( 2010-02-10 02:39:16 ) Full size: 1496x1122
Close up of new grass sprouts
TZ_100_4993.JPG ( 2010-02-10 03:17:26 ) Full size: 1496x1122
Close up of new grass sprouts

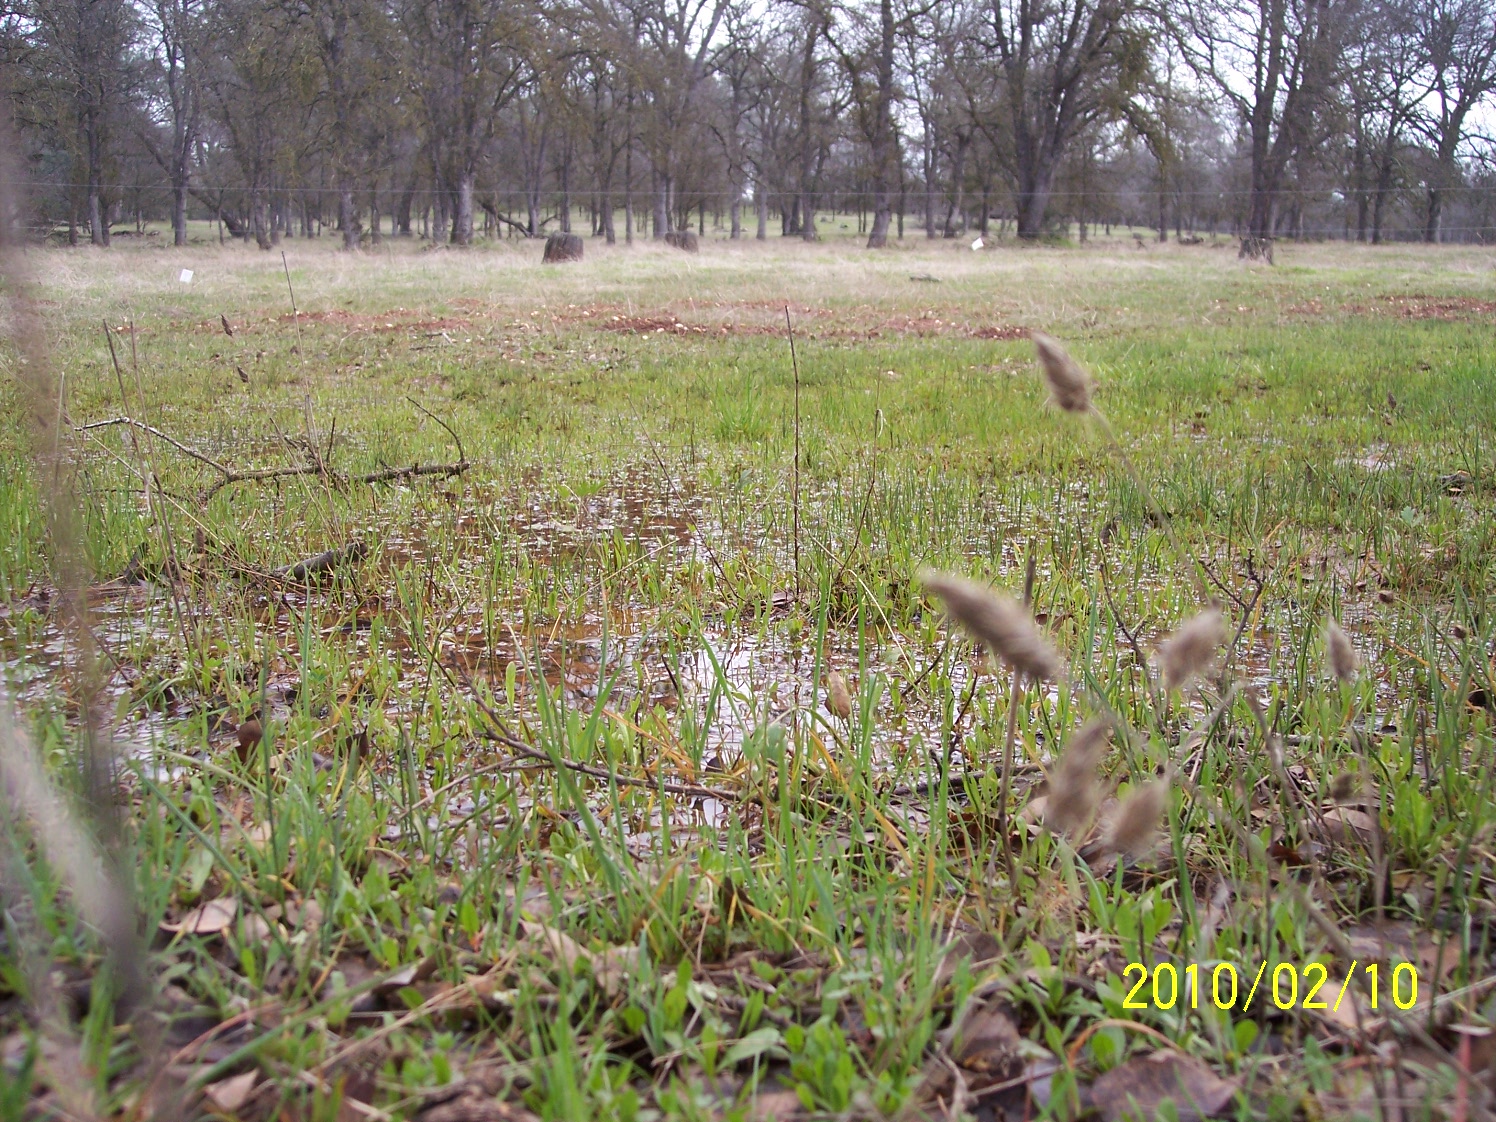
TZ_100_4994.JPG ( 2010-02-10 03:17:42 ) Full size: 1496x1122
Standing water in puddles in the grass

TZ_100_4995.JPG ( 2010-02-10 03:21:42 ) Full size: 1496x1122
Leafless oaks and cloudy skies
16 sets found
No data found for TZ_Fenergy.
11 TZ_tmet graphs found
11 TZ_soilco2 graphs found
Can't check TZ_mixed
3 TZ_mixed graphs found
No data found for TZ_fflux.
8 TZ_fmet graphs found
1 TZ_tram graphs found
3 TZ_co2prof graphs found
No data found for TZ_irt.
No data found for TZ_windprof.
No data found for TZ_tflux.
2 TZ_sm graphs found
Can't check TZ_met
1 TZ_met graphs found
Can't check TZVR_mixed
No data found for TZ_osu.
No data found for TZ_fd.
Tonzi Z-cam data