
Field Notes
<--2019-07-16 10:30:00 | 2019-08-06 10:00:00-->Other sites visited today: Vaira | Tonzi
Phenocam link: Searching...
Tonzi: 2019-07-16 11:30:00 (DOY 197)
Author: Joe Verfaillie
Others: Siyan
Summary: dry and crispy, forgot equipment could not download Floor well and soil co2, swapped out FLIR cal panel CR10X for 23X, Remounted Arable and connected to tower power, checked on soil co2 battery bank and CR1000 IRTs system.
| Tonzi 2019-07-16 Siyan and I arrived at about 11:30. It was clear sunny and hot. At the top of the tower there was a nice breeze from the south but not much at ground level. The grass and ground is nice and crispy. I did not notice any green except over near the pond. We left the electric fences off. I forgot to bring lots of things today. I forgot the silver netbook. We had the white netbook but its USB to serial adapter was missing. There was a Quatech box at Vaira and a USB serial adapter at Tonzi but the white netbook didn’t have drivers for them. I also forgot to bring my USB drive that probably had the drivers. On top of that the white netbook had not gone to sleep on the way out so its battery was already half gone. The Tower computer was running well and had all the FLIR data plus the tower met, the floor met and the OSU data. I was able the get the Tower and Floor flux data as well as the phenocam images. I also managed to get the CR1000 IRTs data and Tower CO2 profile using the radio modem from OSU-SP2. The CR1000 IRTs had lost power one night during the last data collection. I checked the connections on the solar charge controller and cleaned the solar panel that was very dirty with bird droppings. The grass IRT had been knocked out of it holder but was still well pointed at the ground. I put it back in its mount. The data file did not have time or record number but I was able to recreate those columns comparing with the previous file. I replaced the CR10X at the FLIR cal panel with a CR23X sn ????. I should be able to get the data off the CR10X I removed sn ???? in the lab. The CR23X already had its program loaded and I was able to check values with the key pad. All seemed well. I could not get data from The CR200 at the Floor well or the CR23X and the soil CO2 system. Both of these should have enough memory to last until next visit. I checked the solar batteries at the soil CO2 system. This system had been losing power over night. There are six batteries in three pairs for a 24V system – the original four plus two more we added last winter. Two of the originals test a little weak with the load tester so I disconnected them from the bank sn BB-TZ_soilco2. The solar panels were also completely covered with a light layer of dust. Cleaning the panels seemed to improve the performance of the system. I remounted the Arable on the tower top. I was on a post to the east of the southeast corner of the tower where it was in the way of the folding boom. I was hoping to mount it on the boom but didn’t have the parts needed. I ended up mounting it to a horizontal cross piece in the middle of the south side of the tower. Not a bad place but still might be in the way of the folding boom. I also replaced its solar panel with a power line connected to the fan power of the HMP45. It still need work. Siyan did soil moisture, well measurements, DBH, midday water potential and serviced the z-cams. |
Field Data
No tank data
Well Depth
| Date | Location | Depth (feet) |
|---|---|---|
| 2019-07-16 | VR_well | 53.35 |
| 2019-07-16 | TZ_floor | 18.4 |
| 2019-07-16 | TZ_tower | 23.4 |
| 2019-07-16 | TZ_road | 27.7 |
mode = both
Moisture Point Probes TZ
Array
(
[0] => Tower_1
[1] => Floor_South_1
[2] => Floor_West_1
[3] => Soil_Transect_4_1
[4] => Soil_Transect_3_1
[5] => Soil_Transect_2_1
[6] => Soil_Transect_1_1
[7] => SoilCO2_West_A_1
[8] => SoilCO2_West_B_1
[9] => SoilCO2_West_C_1
[10] => Tower_2
[11] => Floor_South_2
[12] => Floor_West_2
[13] => Soil_Transect_4_2
[14] => Soil_Transect_3_2
[15] => Soil_Transect_2_2
[16] => Soil_Transect_1_2
[17] => SoilCO2_West_A_2
[18] => SoilCO2_West_B_2
[19] => SoilCO2_West_C_2
[20] => Tower_3
[21] => Floor_South_3
[22] => Soil_Transect_4_3
[23] => Soil_Transect_3_3
[24] => Soil_Transect_2_3
[25] => Soil_Transect_1_3
[26] => SoilCO2_West_A_3
[27] => SoilCO2_West_B_3
[28] => SoilCO2_West_C_3
[29] => Tower_4
[30] => Soil_Transect_4_4
[31] => Soil_Transect_3_4
[32] => Soil_Transect_2_4
[33] => Soil_Transect_1_4
[34] => SoilCO2_West_A_4
[35] => SoilCO2_West_B_4
[36] => SoilCO2_West_C_4
)
| Date | DOY | Rep | Depth | Tower_1 |
Floor_South_1 |
Floor_West_1 |
Soil_Transect_4_1 |
Soil_Transect_3_1 |
Soil_Transect_2_1 |
Soil_Transect_1_1 |
SoilCO2_West_A_1 |
SoilCO2_West_B_1 |
SoilCO2_West_C_1 |
Tower_2 |
Floor_South_2 |
Floor_West_2 |
Soil_Transect_4_2 |
Soil_Transect_3_2 |
Soil_Transect_2_2 |
Soil_Transect_1_2 |
SoilCO2_West_A_2 |
SoilCO2_West_B_2 |
SoilCO2_West_C_2 |
Tower_3 |
Floor_South_3 |
Soil_Transect_4_3 |
Soil_Transect_3_3 |
Soil_Transect_2_3 |
Soil_Transect_1_3 |
SoilCO2_West_A_3 |
SoilCO2_West_B_3 |
SoilCO2_West_C_3 |
Tower_4 |
Soil_Transect_4_4 |
Soil_Transect_3_4 |
Soil_Transect_2_4 |
Soil_Transect_1_4 |
SoilCO2_West_A_4 |
SoilCO2_West_B_4 |
SoilCO2_West_C_4 |
Avg | Spacial Count |
Measurement Count |
|---|---|---|---|---|---|---|---|---|---|---|---|---|---|---|---|---|---|---|---|---|---|---|---|---|---|---|---|---|---|---|---|---|---|---|---|---|---|---|---|---|---|---|---|
| 2019-07-16 | 197 | 0 | nan | 5 | 2.1 | 11.1 | 3 | 5.1 | 1.2 | 1.2 | 10 | 8.6 | 6.3 | 12.4 | 7.8 | 11.2 | 8.1 | 16.4 | 13.3 | 5.1 | 8.7 | 1.1 | 13.3 | 15.9 | 2.9 | 19.6 | 16.8 | 17 | 14.8 | 16.2 | 25.9 | 12.6 | 20.5 | 12.5 | 20.2 | 25.4 | 13 | 17 | 19.8 | 4.8 | |||
| 2019-07-16 | 197 | 1 | nan | 4.5 | 4.5 | 11.1 | 3.3 | 5.6 | 0.9 | 0.9 | 7.4 | 10.3 | 1.8 | 12.7 | 8.1 | 10 | 8.1 | 16.5 | 23.6 | 4.8 | 9.7 | 0.5 | 13 | 15.4 | 22.6 | 10.9 | 16.9 | 17.3 | 14.5 | 15.6 | 14.8 | 13.4 | 19.3 | 12.5 | 19.9 | 25.1 | 13.3 | 18.8 | 19.6 | 24.8 | |||
| 2019-07-16 | 197 | Avg | 0-15cm | 0 | 0 | ||||||||||||||||||||||||||||||||||||||
| 2019-07-16 | 197 | Avg | 15-30cm | 0 | 0 | ||||||||||||||||||||||||||||||||||||||
| 2019-07-16 | 197 | Avg | 30-45cm | 0 | 0 | ||||||||||||||||||||||||||||||||||||||
| 2019-07-16 | 197 | Avg | 45-60cm | 0 | 0 |
mode = both
Moisture Point Probes VR
Array
(
[0] => Solar_Panels_1
[1] => Flux_Tower_1
[2] => Biomass_Cage_1
[3] => Solar_Panels_2
[4] => Flux_Tower_2
[5] => Biomass_Cage_2
[6] => Solar_Panels_3
[7] => Flux_Tower_3
[8] => Biomass_Cage_3
[9] => Solar_Panels_4
[10] => Flux_Tower_4
[11] => Biomass_Cage_4
)
| Date | DOY | Rep | Depth | Solar_Panels_1 |
Flux_Tower_1 |
Biomass_Cage_1 |
Solar_Panels_2 |
Flux_Tower_2 |
Biomass_Cage_2 |
Solar_Panels_3 |
Flux_Tower_3 |
Biomass_Cage_3 |
Solar_Panels_4 |
Flux_Tower_4 |
Biomass_Cage_4 |
Avg | Spacial Count |
Measurement Count |
|---|---|---|---|---|---|---|---|---|---|---|---|---|---|---|---|---|---|---|
| 2019-07-16 | 197 | 0 | nan | 3 | 0.4 | 2.7 | 11.2 | 11.8 | 6.9 | 16.8 | 6.7 | 27.3 | 30.2 | 18.9 | 20.8 | |||
| 2019-07-16 | 197 | 1 | nan | 3 | 0.1 | 2.1 | 11.5 | 12.1 | 6.9 | 16.2 | 7.6 | 7.3 | 29.9 | 18 | 20.5 | |||
| 2019-07-16 | 197 | Avg | 0-15cm | 0 | 0 | |||||||||||||
| 2019-07-16 | 197 | Avg | 15-30cm | 0 | 0 | |||||||||||||
| 2019-07-16 | 197 | Avg | 30-45cm | 0 | 0 | |||||||||||||
| 2019-07-16 | 197 | Avg | 45-60cm | 0 | 0 |
No TZ grass heigth found
No VR grass heigth found
Tree DBH
| Date | Tag# | Reading (mm) |
|---|---|---|
| 2019-07-16 | 1 | 20.2 |
| 2019-07-16 | 2 | 13.1 |
| 2019-07-16 | 245 | 11.0 |
| 2019-07-16 | 3 | 17.5 |
| 2019-07-16 | 4 | 5.0 |
| 2019-07-16 | 5 | 15.5 |
| 2019-07-16 | 7 | 19.1 |
| 2019-07-16 | 72 | 6.1 |
| 2019-07-16 | 79 | 19.6 |
| 2019-07-16 | 8 | 8.4 |
Water Potential - mode: raw
| Time | Species | Tree | readings (bar) | ||
|---|---|---|---|---|---|
| 2019-07-16 13:00:00 | OAK | 102 | -37 | -35 | -22 |
| 2019-07-16 13:00:00 | OAK | 35 | -24 | -35 | -27 |
| 2019-07-16 13:00:00 | OAK | 92 | -19 | -35 | -29 |
| 2019-07-16 13:25:00 | PINE | OLD | -14 | -12 | -22 |
| 2019-07-16 13:25:00 | PINE | YNG | -2 | -3 | -5 |
No TZ Grass Biomass data found
No TZ OakLeaves Biomass data found
No TZ PineNeedles Biomass data found
1 photos found
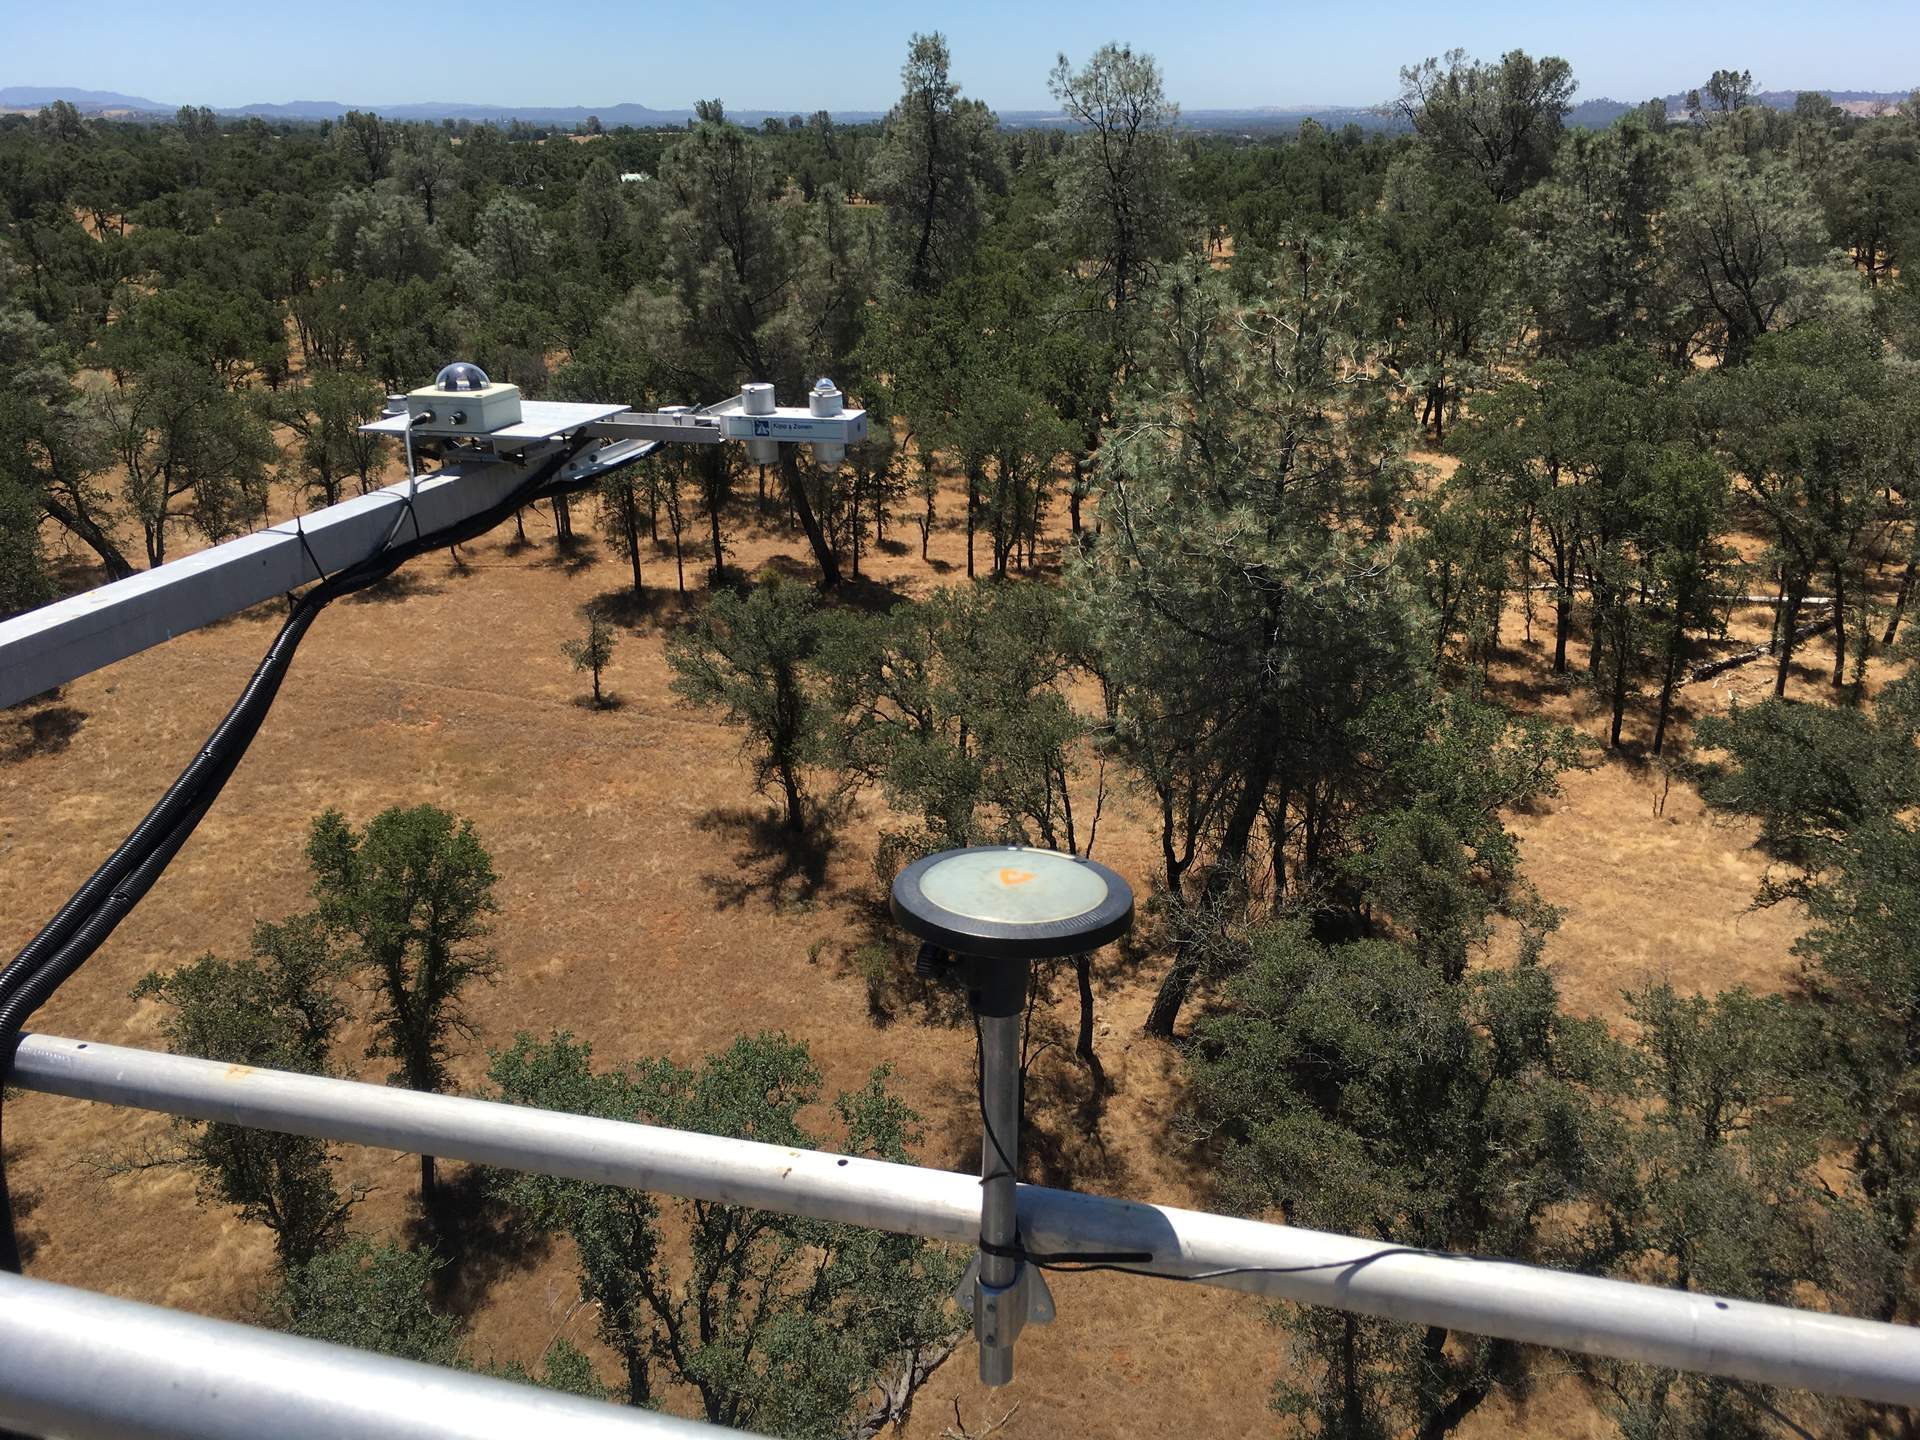
20190716TZ_RadBoomArable.jpg ( 2019-07-16 00:00:00 ) Full size: 1920x1440
Arable remounted in another temporary location
16 sets found
No data found for TZ_Fenergy.
11 TZ_tmet graphs found
11 TZ_soilco2 graphs found
Can't check TZ_mixed
3 TZ_mixed graphs found
1 TZ_fflux graphs found
8 TZ_fmet graphs found
No data found for TZ_tram.
3 TZ_co2prof graphs found
1 TZ_irt graphs found
No data found for TZ_windprof.
1 TZ_tflux graphs found
2 TZ_sm graphs found
Can't check TZ_met
1 TZ_met graphs found
Can't check TZVR_mixed
8 TZ_osu graphs found
No data found for TZ_fd.
Tonzi Z-cam data