
Field Notes
<--2019-02-20 10:30:00 | 2019-03-29 09:00:00-->Other sites visited today: Vaira
Phenocam link: Searching...
Tonzi: 2019-03-11 11:30:00 (DOY 70)
Author: Joe Verfaillie
Others: Siyan, Ana
Summary: Regular fieldwork, green and wet, SMAP crew left wheel tracks, added new computer and radios, cleaned acorns out of JPL boxes, evidence of wild pigs, Ana made distance measurements from FLIR
| Tonzi 2019-03-11 I arrived at about 11:30 with Ana and Siyan. The road was wet and muddy with lots of wheel tracks from the SMAP crew coming and going over the last few days. They also left several tacks off the edge of the road where is passes the Tower. One tree near Irish Hill Rd and the one near Mr Tonzi’s house had some leaves. The pond is full and the ground is soggy. I saw places where algae maybe grew in a puddle but was now on the wet ground. I lowered the computer box a little on the tower and put in a new box above it. The new box has a LattePanda with a touch screen. The new computer has a battery to keep its clock running on power out and should restart itself every Monday at 8:15. It powered up and connect to the FLIR and the Tower top CR1000 over Ethernet. I put a radio (sn 34362) in the box and connected to OSU-SP2 CR1000. I downloaded all the data from SP2 over the radio link and left it set up to grab new data every 5min. I put a radio (sn 35754) in the SP3 box and was able to connect to it too. I tried to download just the 30min data from it but only got the last two days. So far it looks okay but still needs some set up work. I collected the Tower and Floor eddy data. Ana took some measurements to get distances for the FLIR field of view. She also collected data from the cal panels and the IRT system. Siyan collected the rest of the data, did the regular fieldwork and serviced the z-cams. I cleaned several hundred acorns out of the JPL spectrometer boxes and stuffed some foam in the holes. I left the solar charger controller box open but got lucky and Ruzbeh from SMAP was there later in the day and closed it for me. There was some disturbed ground around the base of some trees to the southeast of the tower past the DBH trees C7 and C8. I think it was possibly wild pigs. I forgot the tags from the DBH trees. |
Field Data
No tank data
Well Depth
| Date | Location | Depth (feet) |
|---|---|---|
| 2019-03-11 | VR_well | 49.7 |
| 2019-03-11 | TZ_floor | 18.4 |
| 2019-03-11 | TZ_tower | 21.2 |
| 2019-03-11 | TZ_road | 25.6 |
| 2019-03-11 | VR_pond | 22.38 |
mode = both
Moisture Point Probes TZ
Array
(
[0] => Tower_1
[1] => Floor_South_1
[2] => Floor_West_1
[3] => Soil_Transect_4_1
[4] => Soil_Transect_3_1
[5] => Soil_Transect_2_1
[6] => Soil_Transect_1_1
[7] => SoilCO2_West_A_1
[8] => SoilCO2_West_B_1
[9] => SoilCO2_West_C_1
[10] => Tower_2
[11] => Floor_South_2
[12] => Floor_West_2
[13] => Soil_Transect_4_2
[14] => Soil_Transect_3_2
[15] => Soil_Transect_2_2
[16] => Soil_Transect_1_2
[17] => SoilCO2_West_A_2
[18] => SoilCO2_West_B_2
[19] => SoilCO2_West_C_2
[20] => Tower_3
[21] => Floor_South_3
[22] => Floor_West_3
[23] => Soil_Transect_4_3
[24] => Soil_Transect_3_3
[25] => Soil_Transect_2_3
[26] => Soil_Transect_1_3
[27] => SoilCO2_West_A_3
[28] => SoilCO2_West_B_3
[29] => SoilCO2_West_C_3
[30] => Tower_4
[31] => Floor_South_4
[32] => Floor_West_4
[33] => Soil_Transect_4_4
[34] => Soil_Transect_3_4
[35] => Soil_Transect_2_4
[36] => Soil_Transect_1_4
[37] => SoilCO2_West_A_4
[38] => SoilCO2_West_B_4
[39] => SoilCO2_West_C_4
)
| Date | DOY | Rep | Depth | Tower_1 |
Floor_South_1 |
Floor_West_1 |
Soil_Transect_4_1 |
Soil_Transect_3_1 |
Soil_Transect_2_1 |
Soil_Transect_1_1 |
SoilCO2_West_A_1 |
SoilCO2_West_B_1 |
SoilCO2_West_C_1 |
Tower_2 |
Floor_South_2 |
Floor_West_2 |
Soil_Transect_4_2 |
Soil_Transect_3_2 |
Soil_Transect_2_2 |
Soil_Transect_1_2 |
SoilCO2_West_A_2 |
SoilCO2_West_B_2 |
SoilCO2_West_C_2 |
Tower_3 |
Floor_South_3 |
Floor_West_3 |
Soil_Transect_4_3 |
Soil_Transect_3_3 |
Soil_Transect_2_3 |
Soil_Transect_1_3 |
SoilCO2_West_A_3 |
SoilCO2_West_B_3 |
SoilCO2_West_C_3 |
Tower_4 |
Floor_South_4 |
Floor_West_4 |
Soil_Transect_4_4 |
Soil_Transect_3_4 |
Soil_Transect_2_4 |
Soil_Transect_1_4 |
SoilCO2_West_A_4 |
SoilCO2_West_B_4 |
SoilCO2_West_C_4 |
Avg | Spacial Count |
Measurement Count |
|---|---|---|---|---|---|---|---|---|---|---|---|---|---|---|---|---|---|---|---|---|---|---|---|---|---|---|---|---|---|---|---|---|---|---|---|---|---|---|---|---|---|---|---|---|---|---|
| 2019-03-11 | 70 | 0 | nan | 41.7 | 36.8 | 43.7 | 35.5 | 25.8 | 28.2 | 32.6 | 39.3 | 38.2 | 37 | 42.9 | 45.1 | 36.5 | 39.5 | 33.2 | 34.1 | 31.6 | 31.6 | 24 | 34.4 | 37.7 | 44.6 | 42.1 | 40.2 | 34.1 | 36.6 | 36.6 | 37.4 | 41 | 39.9 | 43 | 55.4 | 46.3 | 36.2 | 45.6 | 49.4 | 40.3 | 46.8 | 51.4 | 43.8 | |||
| 2019-03-11 | 70 | 1 | nan | 42.6 | 35.8 | 41.4 | 37 | 26.4 | 27.3 | 32.3 | 32 | 37.3 | 36.4 | 42.6 | 45.1 | 36.2 | 42.3 | 32.4 | 33.5 | 31.6 | 31.3 | 29.8 | 32.9 | 37.4 | 43 | 40.7 | 42.4 | 33.5 | 36 | 36.3 | 37.4 | 42.4 | 38.6 | 42 | 54.6 | 44.8 | 45.4 | 46 | 48.3 | 40.8 | 47.4 | 52.8 | 50.6 | |||
| 2019-03-11 | 70 | Avg | 0-15cm | 0 | 0 | |||||||||||||||||||||||||||||||||||||||||
| 2019-03-11 | 70 | Avg | 15-30cm | 0 | 0 | |||||||||||||||||||||||||||||||||||||||||
| 2019-03-11 | 70 | Avg | 30-45cm | 0 | 0 | |||||||||||||||||||||||||||||||||||||||||
| 2019-03-11 | 70 | Avg | 45-60cm | 0 | 0 |
mode = both
Moisture Point Probes VR
Array
(
[0] => Solar_Panels_1
[1] => Flux_Tower_1
[2] => Biomass_Cage_1
[3] => Solar_Panels_2
[4] => Flux_Tower_2
[5] => Biomass_Cage_2
[6] => Solar_Panels_3
[7] => Flux_Tower_3
[8] => Biomass_Cage_3
[9] => Solar_Panels_4
[10] => Flux_Tower_4
[11] => Biomass_Cage_4
)
| Date | DOY | Rep | Depth | Solar_Panels_1 |
Flux_Tower_1 |
Biomass_Cage_1 |
Solar_Panels_2 |
Flux_Tower_2 |
Biomass_Cage_2 |
Solar_Panels_3 |
Flux_Tower_3 |
Biomass_Cage_3 |
Solar_Panels_4 |
Flux_Tower_4 |
Biomass_Cage_4 |
Avg | Spacial Count |
Measurement Count |
|---|---|---|---|---|---|---|---|---|---|---|---|---|---|---|---|---|---|---|
| 2019-03-11 | 70 | 0 | nan | 39.9 | 25 | 22.9 | 27.1 | 31.9 | 22.2 | 31.8 | 23.5 | 32.9 | 42 | 27.9 | 33.7 | |||
| 2019-03-11 | 70 | 1 | nan | 32.3 | 25 | 22.9 | 27.4 | 30.7 | 22.5 | 31.5 | 21.8 | 32.7 | 42.5 | 26.5 | 34 | |||
| 2019-03-11 | 70 | Avg | 0-15cm | 0 | 0 | |||||||||||||
| 2019-03-11 | 70 | Avg | 15-30cm | 0 | 0 | |||||||||||||
| 2019-03-11 | 70 | Avg | 30-45cm | 0 | 0 | |||||||||||||
| 2019-03-11 | 70 | Avg | 45-60cm | 0 | 0 |
No TZ grass heigth found
No VR grass heigth found
Tree DBH
| Date | Tag# | Reading (mm) |
|---|---|---|
| 2019-03-11 | 1 | 13.4 |
| 2019-03-11 | 102 | 18.8 |
| 2019-03-11 | 2 | 12.3 |
| 2019-03-11 | 245 | 10.0 |
| 2019-03-11 | 3 | 13.1 |
| 2019-03-11 | 4 | 4.9 |
| 2019-03-11 | 5 | 12.0 |
| 2019-03-11 | 7 | 9.9 |
| 2019-03-11 | 72 | 18.9 |
| 2019-03-11 | 79 | 15.7 |
| 2019-03-11 | 8 | 7.8 |
No water potential data found
No TZ Grass Biomass data found
No TZ OakLeaves Biomass data found
No TZ PineNeedles Biomass data found
1 photos found
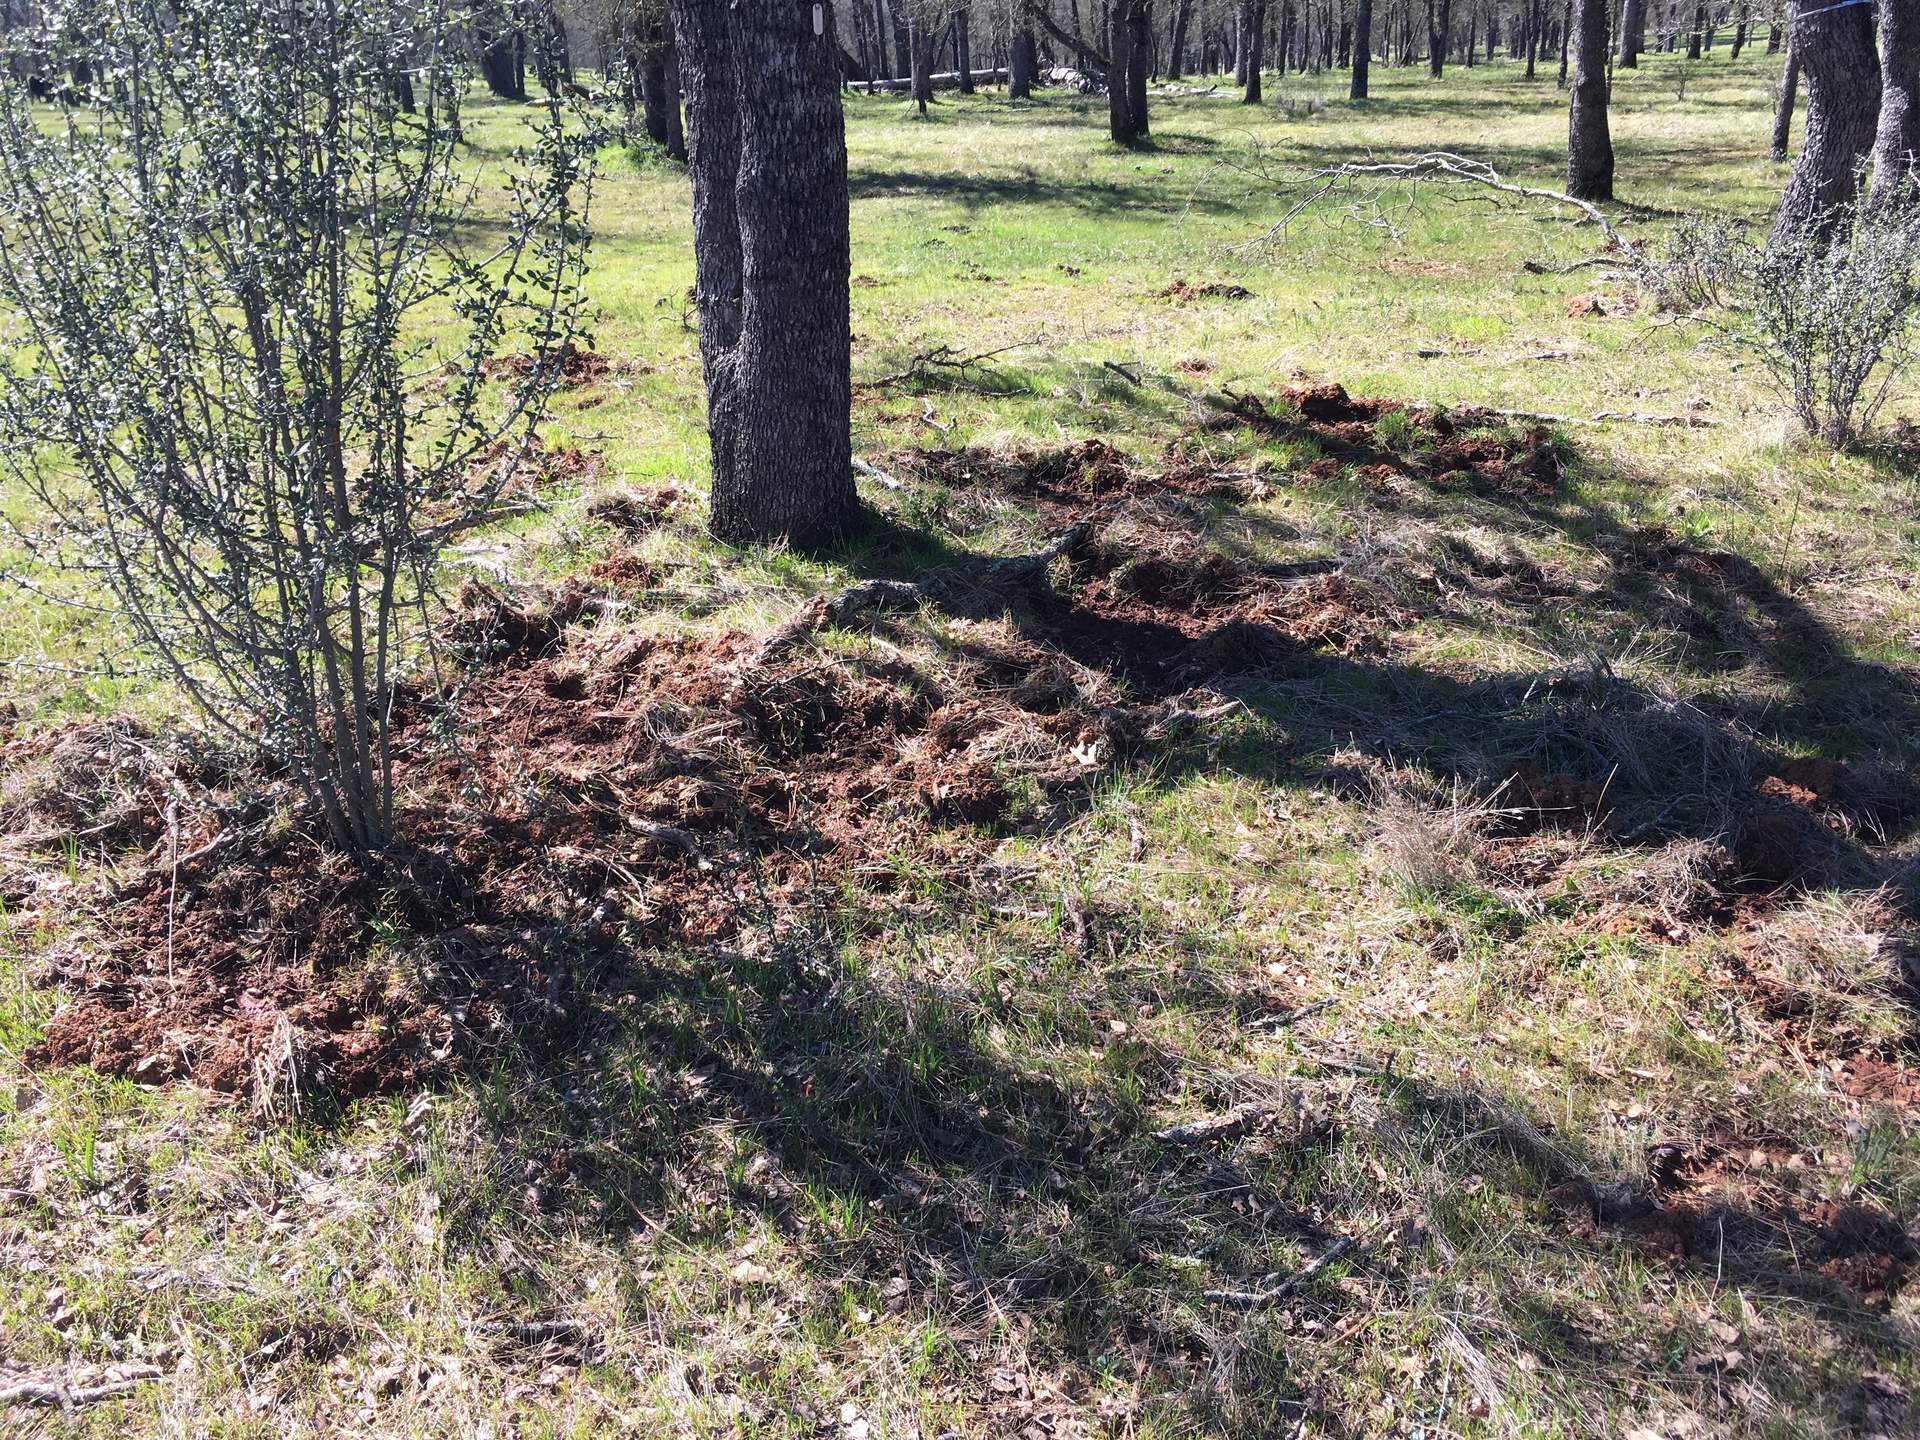
20190311TZ_PigDigging.jpg ( 2019-03-11 13:07:06 ) Full size: 1920x1440
Disturbed soil possibly from wild pig digging
16 sets found
No data found for TZ_Fenergy.
11 TZ_tmet graphs found
11 TZ_soilco2 graphs found
Can't check TZ_mixed
3 TZ_mixed graphs found
1 TZ_fflux graphs found
8 TZ_fmet graphs found
No data found for TZ_tram.
3 TZ_co2prof graphs found
1 TZ_irt graphs found
No data found for TZ_windprof.
1 TZ_tflux graphs found
2 TZ_sm graphs found
Can't check TZ_met
1 TZ_met graphs found
Can't check TZVR_mixed
8 TZ_osu graphs found
No data found for TZ_fd.
Tonzi Z-cam data