
Field Notes
<--2019-02-20 09:30:00 | 2019-03-29 09:15:00-->Other sites visited today: Tonzi
Phenocam link: Searching...
Vaira: 2019-03-11 10:00:00 (DOY 70)
Author: Joe Verfaillie
Others: Siyan, Ana
Summary: Standard fieldwork, went to the pond, green and wet
| Vaira 2019-03-11 I arrived at about 10:00am with Siyan and Ana. It was clear, sunny and warm. The grass is very green but not too tall yet. Everything is very wet. The pond is overflowing at a good rate. We did the standard data collection at the tower. I took some spectra with the JAZ to compare with the older spectrometer. Ana measured the well. We went to the pond – the road was fine with four wheel drive. The tree is still down across the dam. We cut a few limbs with a hand saw. The pond is full and overflowing. The pond level was 22.38ft. I forgot to check the locations on the SRS NDVI sensors. |
Field Data
No tank data
Well Depth
| Date | Location | Depth (feet) |
|---|---|---|
| 2019-03-11 | VR_well | 49.7 |
| 2019-03-11 | TZ_floor | 18.4 |
| 2019-03-11 | TZ_tower | 21.2 |
| 2019-03-11 | TZ_road | 25.6 |
| 2019-03-11 | VR_pond | 22.38 |
mode = both
Moisture Point Probes TZ
Array
(
[0] => Tower_1
[1] => Floor_South_1
[2] => Floor_West_1
[3] => Soil_Transect_4_1
[4] => Soil_Transect_3_1
[5] => Soil_Transect_2_1
[6] => Soil_Transect_1_1
[7] => SoilCO2_West_A_1
[8] => SoilCO2_West_B_1
[9] => SoilCO2_West_C_1
[10] => Tower_2
[11] => Floor_South_2
[12] => Floor_West_2
[13] => Soil_Transect_4_2
[14] => Soil_Transect_3_2
[15] => Soil_Transect_2_2
[16] => Soil_Transect_1_2
[17] => SoilCO2_West_A_2
[18] => SoilCO2_West_B_2
[19] => SoilCO2_West_C_2
[20] => Tower_3
[21] => Floor_South_3
[22] => Floor_West_3
[23] => Soil_Transect_4_3
[24] => Soil_Transect_3_3
[25] => Soil_Transect_2_3
[26] => Soil_Transect_1_3
[27] => SoilCO2_West_A_3
[28] => SoilCO2_West_B_3
[29] => SoilCO2_West_C_3
[30] => Tower_4
[31] => Floor_South_4
[32] => Floor_West_4
[33] => Soil_Transect_4_4
[34] => Soil_Transect_3_4
[35] => Soil_Transect_2_4
[36] => Soil_Transect_1_4
[37] => SoilCO2_West_A_4
[38] => SoilCO2_West_B_4
[39] => SoilCO2_West_C_4
)
| Date | DOY | Rep | Depth | Tower_1 |
Floor_South_1 |
Floor_West_1 |
Soil_Transect_4_1 |
Soil_Transect_3_1 |
Soil_Transect_2_1 |
Soil_Transect_1_1 |
SoilCO2_West_A_1 |
SoilCO2_West_B_1 |
SoilCO2_West_C_1 |
Tower_2 |
Floor_South_2 |
Floor_West_2 |
Soil_Transect_4_2 |
Soil_Transect_3_2 |
Soil_Transect_2_2 |
Soil_Transect_1_2 |
SoilCO2_West_A_2 |
SoilCO2_West_B_2 |
SoilCO2_West_C_2 |
Tower_3 |
Floor_South_3 |
Floor_West_3 |
Soil_Transect_4_3 |
Soil_Transect_3_3 |
Soil_Transect_2_3 |
Soil_Transect_1_3 |
SoilCO2_West_A_3 |
SoilCO2_West_B_3 |
SoilCO2_West_C_3 |
Tower_4 |
Floor_South_4 |
Floor_West_4 |
Soil_Transect_4_4 |
Soil_Transect_3_4 |
Soil_Transect_2_4 |
Soil_Transect_1_4 |
SoilCO2_West_A_4 |
SoilCO2_West_B_4 |
SoilCO2_West_C_4 |
Avg | Spacial Count |
Measurement Count |
|---|---|---|---|---|---|---|---|---|---|---|---|---|---|---|---|---|---|---|---|---|---|---|---|---|---|---|---|---|---|---|---|---|---|---|---|---|---|---|---|---|---|---|---|---|---|---|
| 2019-03-11 | 70 | 0 | nan | 41.7 | 36.8 | 43.7 | 35.5 | 25.8 | 28.2 | 32.6 | 39.3 | 38.2 | 37 | 42.9 | 45.1 | 36.5 | 39.5 | 33.2 | 34.1 | 31.6 | 31.6 | 24 | 34.4 | 37.7 | 44.6 | 42.1 | 40.2 | 34.1 | 36.6 | 36.6 | 37.4 | 41 | 39.9 | 43 | 55.4 | 46.3 | 36.2 | 45.6 | 49.4 | 40.3 | 46.8 | 51.4 | 43.8 | |||
| 2019-03-11 | 70 | 1 | nan | 42.6 | 35.8 | 41.4 | 37 | 26.4 | 27.3 | 32.3 | 32 | 37.3 | 36.4 | 42.6 | 45.1 | 36.2 | 42.3 | 32.4 | 33.5 | 31.6 | 31.3 | 29.8 | 32.9 | 37.4 | 43 | 40.7 | 42.4 | 33.5 | 36 | 36.3 | 37.4 | 42.4 | 38.6 | 42 | 54.6 | 44.8 | 45.4 | 46 | 48.3 | 40.8 | 47.4 | 52.8 | 50.6 | |||
| 2019-03-11 | 70 | Avg | 0-15cm | 0 | 0 | |||||||||||||||||||||||||||||||||||||||||
| 2019-03-11 | 70 | Avg | 15-30cm | 0 | 0 | |||||||||||||||||||||||||||||||||||||||||
| 2019-03-11 | 70 | Avg | 30-45cm | 0 | 0 | |||||||||||||||||||||||||||||||||||||||||
| 2019-03-11 | 70 | Avg | 45-60cm | 0 | 0 |
mode = both
Moisture Point Probes VR
Array
(
[0] => Solar_Panels_1
[1] => Flux_Tower_1
[2] => Biomass_Cage_1
[3] => Solar_Panels_2
[4] => Flux_Tower_2
[5] => Biomass_Cage_2
[6] => Solar_Panels_3
[7] => Flux_Tower_3
[8] => Biomass_Cage_3
[9] => Solar_Panels_4
[10] => Flux_Tower_4
[11] => Biomass_Cage_4
)
| Date | DOY | Rep | Depth | Solar_Panels_1 |
Flux_Tower_1 |
Biomass_Cage_1 |
Solar_Panels_2 |
Flux_Tower_2 |
Biomass_Cage_2 |
Solar_Panels_3 |
Flux_Tower_3 |
Biomass_Cage_3 |
Solar_Panels_4 |
Flux_Tower_4 |
Biomass_Cage_4 |
Avg | Spacial Count |
Measurement Count |
|---|---|---|---|---|---|---|---|---|---|---|---|---|---|---|---|---|---|---|
| 2019-03-11 | 70 | 0 | nan | 39.9 | 25 | 22.9 | 27.1 | 31.9 | 22.2 | 31.8 | 23.5 | 32.9 | 42 | 27.9 | 33.7 | |||
| 2019-03-11 | 70 | 1 | nan | 32.3 | 25 | 22.9 | 27.4 | 30.7 | 22.5 | 31.5 | 21.8 | 32.7 | 42.5 | 26.5 | 34 | |||
| 2019-03-11 | 70 | Avg | 0-15cm | 0 | 0 | |||||||||||||
| 2019-03-11 | 70 | Avg | 15-30cm | 0 | 0 | |||||||||||||
| 2019-03-11 | 70 | Avg | 30-45cm | 0 | 0 | |||||||||||||
| 2019-03-11 | 70 | Avg | 45-60cm | 0 | 0 |
No TZ grass heigth found
No VR grass heigth found
No VR Tree DBH found
No water potential data found
No VR Grass Biomass data found
No VR OakLeaves Biomass data found
No VR PineNeedles Biomass data found
2 photos found

20190311VR_AnaCutting.jpg ( 2019-03-11 11:03:06 ) Full size: 1920x1440
Ana clearing the downed tree
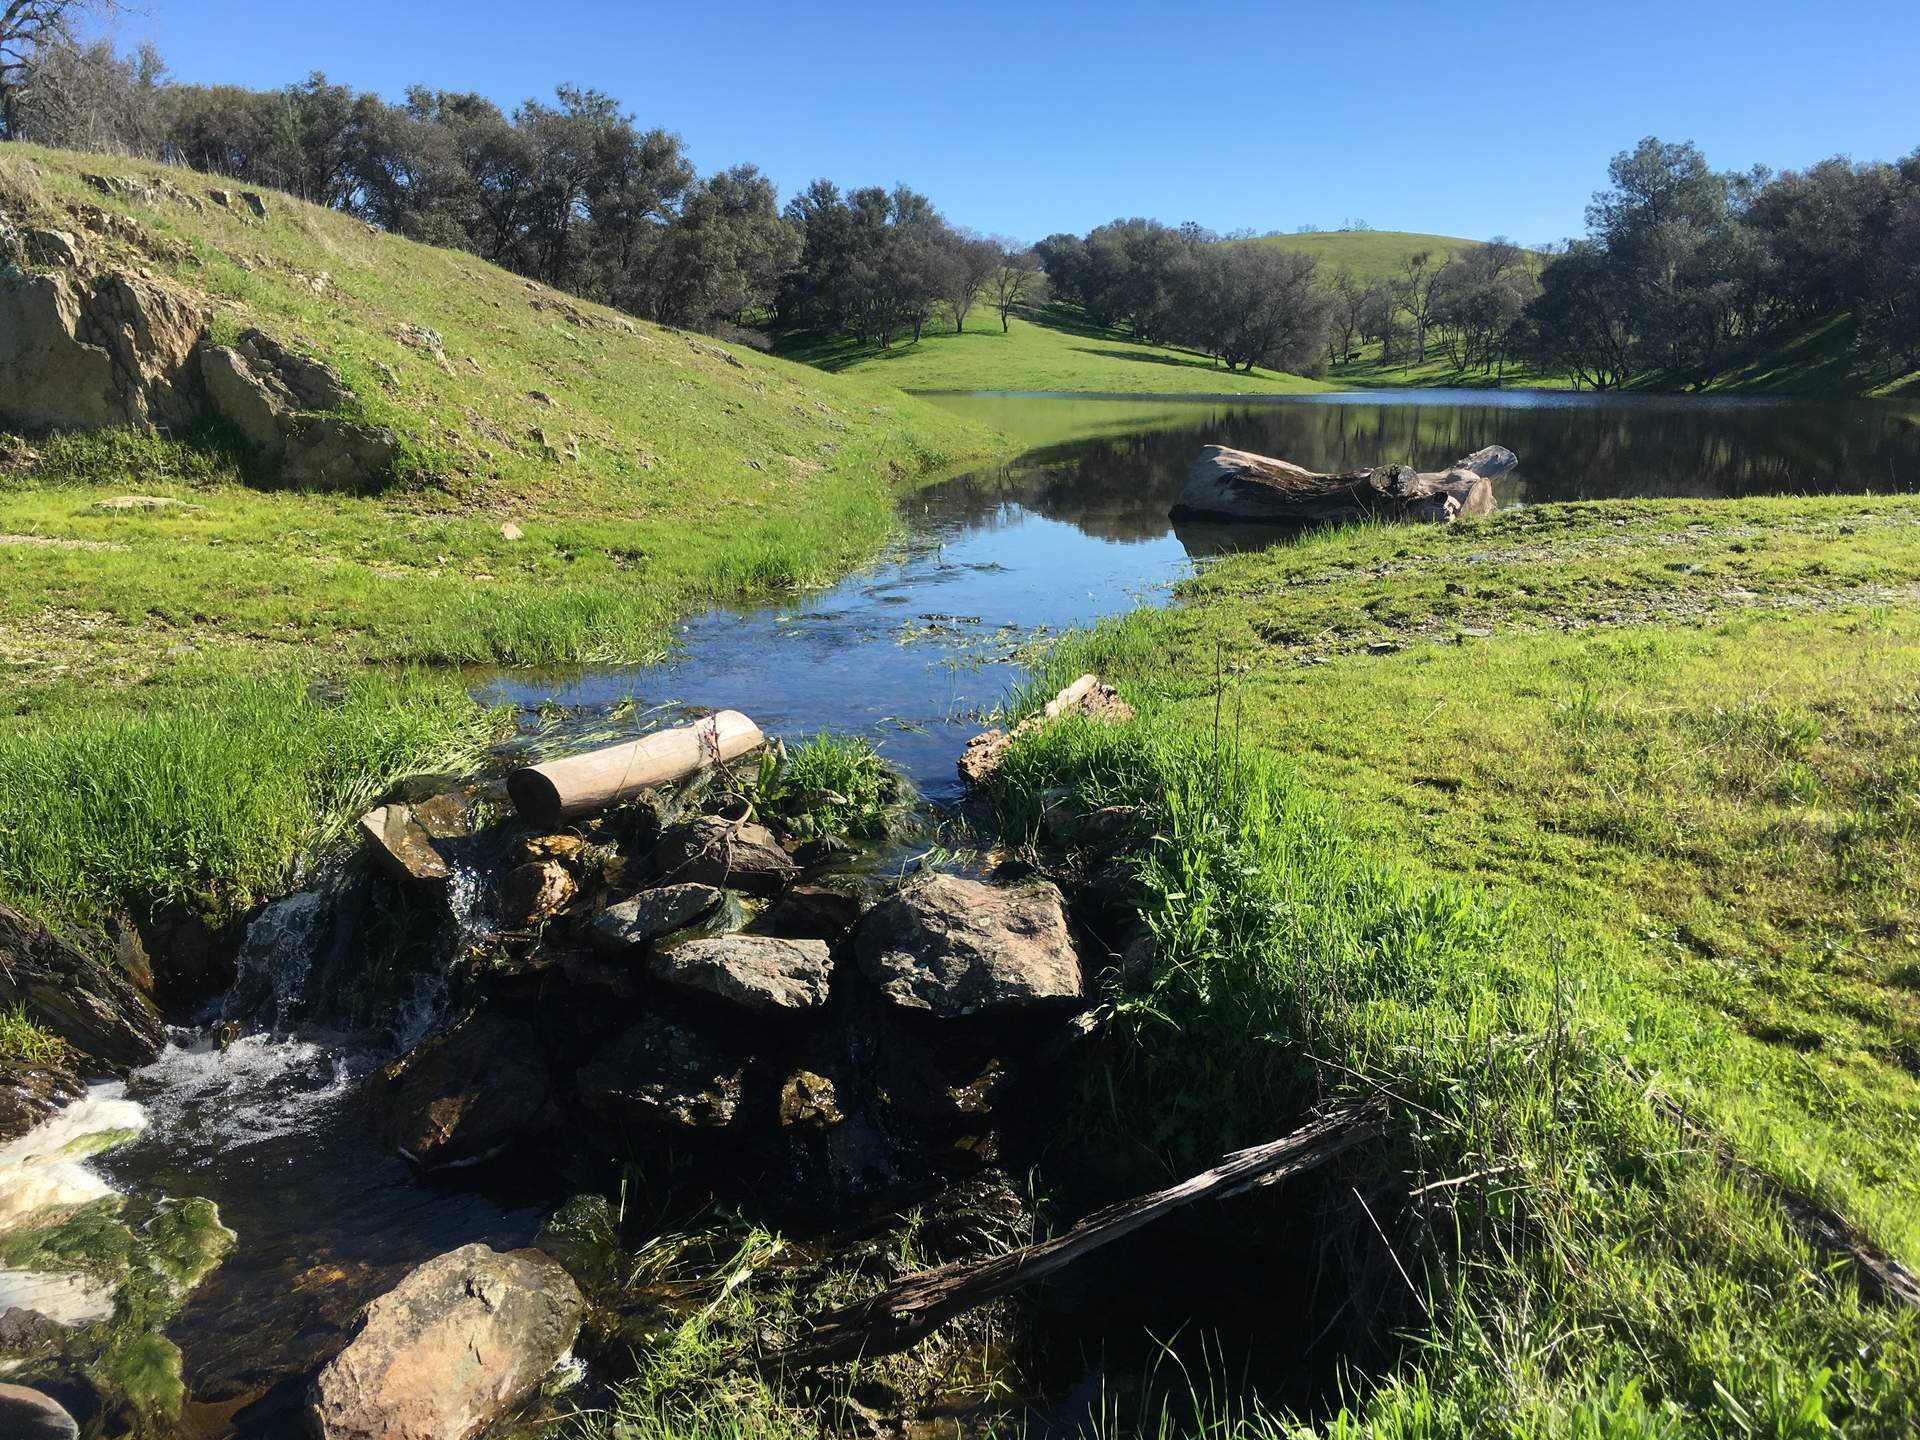
20190311VR_PondSpillway.jpg ( 2019-03-11 10:52:30 ) Full size: 1920x1440
Vaira pond spillway flowing
9 sets found
16 VR_met graphs found
2 VR_flux graphs found
6 VR_soilco2 graphs found
2 VR_pond graphs found
Can't check TZVR_mixed
No data found for VR_fd.
No data found for VR_processed.
No data found for VR_arable.
No data found for VR_soilvue.