Field Notes

<--2019-01-18 12:30:00 | 2019-01-31 10:20:00-->
Other sites visited today: East End | Mayberry | Sherman Barn

Sherman Wetland: 2019-01-24 10:15:00 (DOY 24)
Author: Daphne Szutu
Others: Joe

Summary: Swapped HMP45, changed CR1000 Pakbus address

2019-01-24
Sherman Wetland

Joe and I arrived at 10:15. It was clear, sunny, and calm, but a breeze from the north picked up by the time we left.

The 7500 pressure coefficients were ok. When we arrived, the pressure sensor was reading ~105 kPa. After power-cycling the pressure sensor, it and the 7550 pressure were ~102.3-102.5.

The HMP45 was reading 23C when we arrived, which was too high (7500 temperature was ~15C). We replaced the sensor with another HMP45, sn T2130005 was removed and sn W0730036 went up. After the swap, AirT=13 and RH~65.

I added a sn 38211 label for the CR1000 and changed its Pakbus address from 1 to 11.

We borrowed Bryan's extra key and made 4 copies at the Rio Vista Ace Hardware.

We left at 11:05.

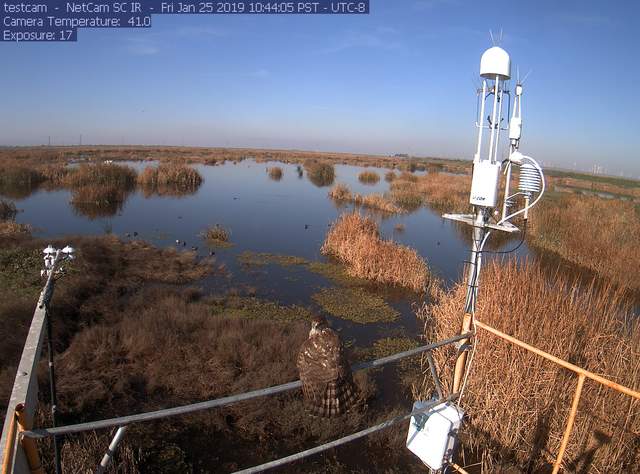
1 photos found

Hawk on railing
siwetland_2019_01_25_104405.jpg ( 2019-01-25 10:53:28 ) Full size: 1296x960
Hawk on railing

Graphs display:
7 sets found

Can't check MBWPEESWGT_mixed
Can't check MBEEWPSWEPGT_cam
16 SW_met graphs found

Explore the graph:Temperatures in a new window

Explore the graph:Water Temperature Profile A in a new window

Explore the graph:Water Temperature Profile B in a new window

Explore the graph:Soil Temperature Profile C2 in a new window

Explore the graph:Soil Heat Flux in a new window

Explore the graph:Four channel Radiometer in a new window

Explore the graph:Sherman Wetland PAR in a new window

Explore the graph:PRI Channels in a new window

Explore the graph:NDVI Channels in a new window

Explore the graph:Water level and Rain in a new window

Explore the graph:Dissolved CO2 in a new window

Explore the graph:Air Pressure in a new window

Explore the graph:Battery Voltage and RH in a new window

Explore the graph:Soil Temperature Profile C1 in a new window

Explore the graph:SRS NDVI and PRI in a new window

Explore the graph:SW miniDOT Dissolved Oxygen in a new window

4 SW_flux graphs found

Explore the graph:CO2 and H2O in a new window

Explore the graph:Wind in a new window

Explore the graph:Methane in a new window

Explore the graph:Data Counts in a new window

Can't check MBSWEEWPBCBA
Can't check SW_Temp
14 SW_Temp graphs found

Explore the graph:Temperatures in a new window

Explore the graph:CO2 and H2O in a new window

Explore the graph:Wind in a new window

Explore the graph:Methane in a new window

Explore the graph:Data Counts in a new window

Explore the graph:Temperature Profile A in a new window

Explore the graph:Temperature Profile B in a new window

Explore the graph:Temperature Profile C in a new window

Explore the graph:Soil Heat Flux in a new window

Explore the graph:Four-channel radiometer in a new window

Explore the graph:NDVI Channels in a new window

Explore the graph:PAR in a new window

Explore the graph:Air Pressure and Water Level in a new window

Explore the graph:Air T and RH in a new window

No data found for SW_arable.