
Field Notes
<--2018-11-28 13:50:00 | 2018-12-18 13:05:00-->Other sites visited today: Sherman Wetland | West Pond
Phenocam link: Searching...
East End: 2018-12-06 10:15:00 (DOY 340)
Author: Joe Verfaillie
Others: Alex, Karen, Mishal
Summary: Deployment of decomposition bags, removed old DO sensor, check on camera and Licor_GHG.
| East End 2018-12-06 I arrived at about 10:15 with Alex, Karen and Mishal. It was clear sunny and cool with a mounting breeze. The wetland is mostly brown. The water level looked about normal. The conductivity sensor was out of the water because someone had stepped on the cables. I removed the old Campbell DO sensor sn DO-06, which isn't working and has been made obsolete by the MiniDot. I did not modify the met program, but jumped its channel (3) on the mux so it should read zero. I moved the conductivity over to the scaffolding where the Eos CO2 and MiniDot are so that its cable is less vulnerable. The water level sensor is still in the well but I put some flagging on its cable so hopefully people will stop stepping on it. The camera was still running so I did not change its settings. The 7700 was reporting a clock sync error so I set it to slave and that seemed to fix it. The GHG time was also ahead by about 4min so I reset it. Alex, Karen and Mishal got busy putting decomposition bags into the wetland. (Alex details) |
2 photos found
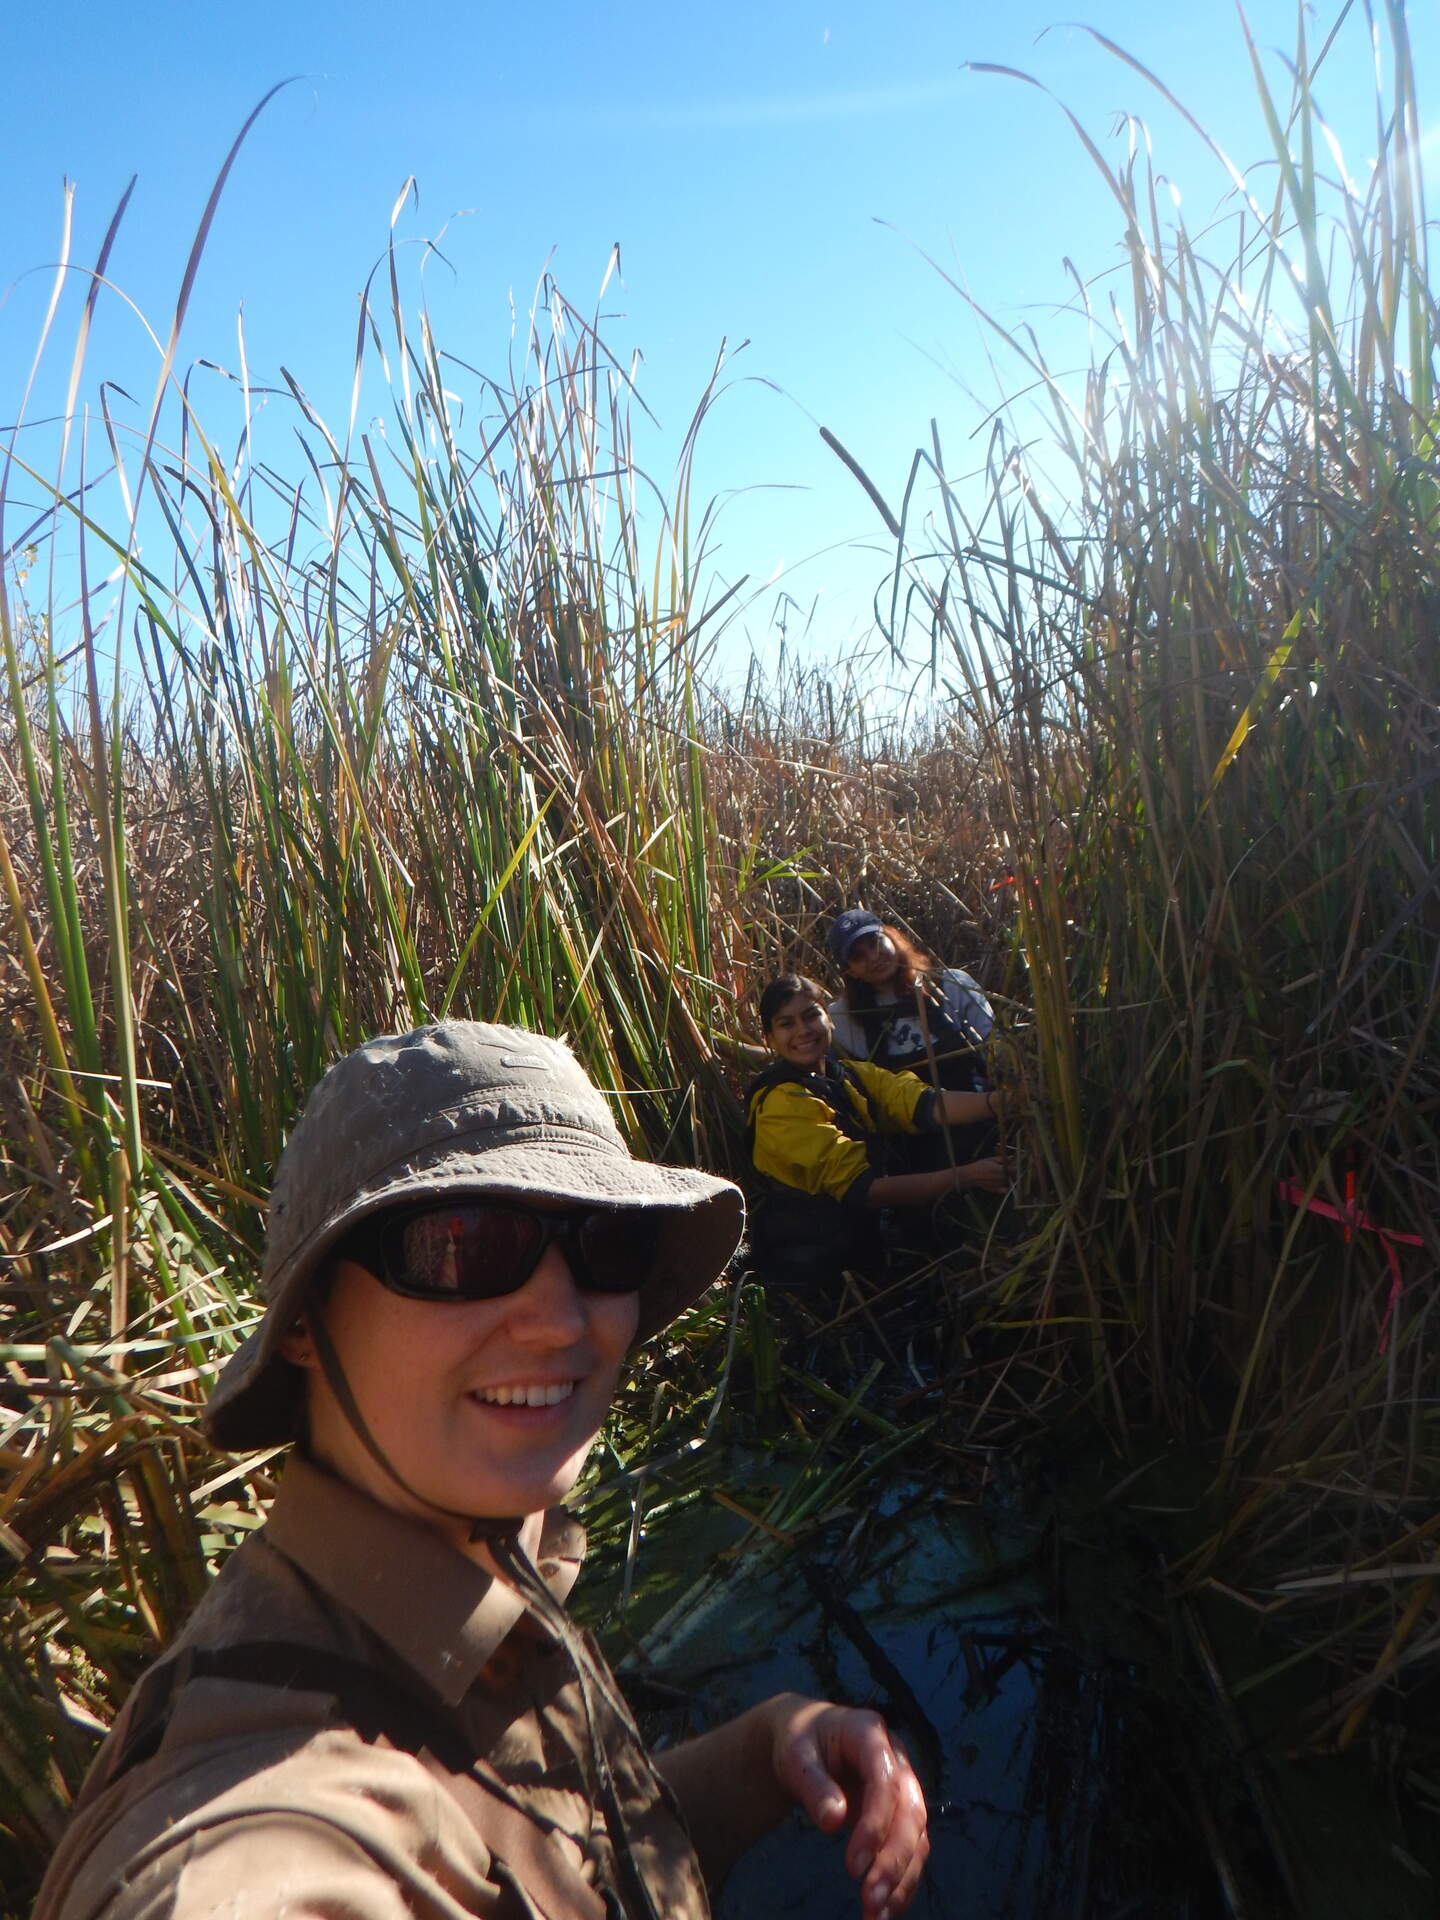
20181206EE_AlexMishalKaren.jpg ( 2018-12-06 21:00:31 ) Full size: 1440x1920
Alex, Mishal, and Karen on site collecting plants for litter decomposition experiment
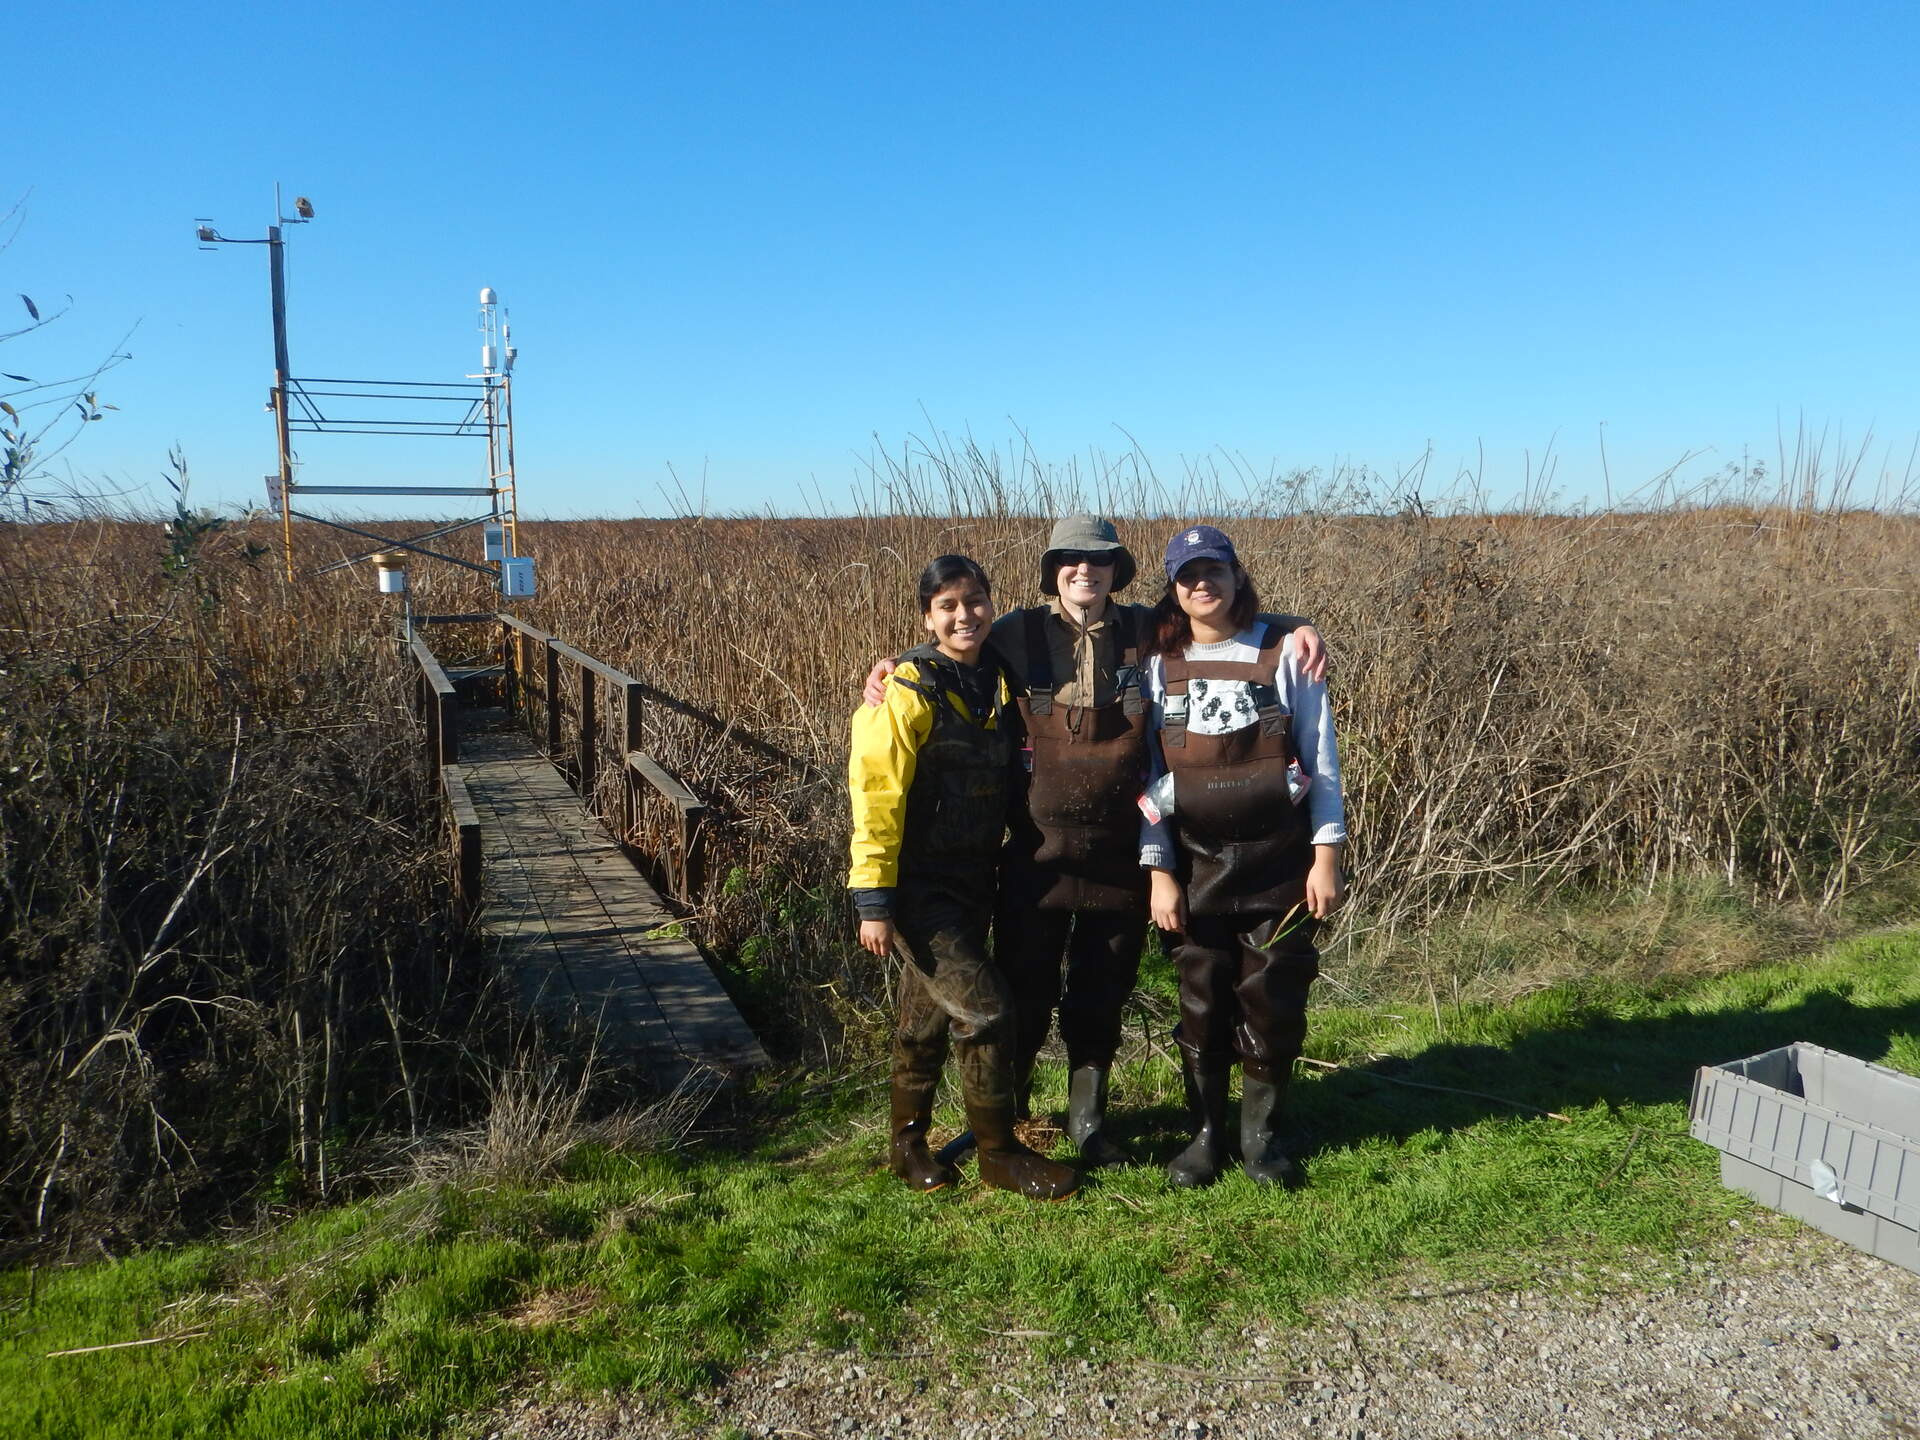
20181206EE_AlexMishalKaren2.jpg ( 2018-12-06 21:06:39 ) Full size: 1920x1440
Karen, Alex, and Mishal on site
11 sets found
14 EE_met graphs found
Can't check EE_mixed
1 EE_mixed graphs found
8 EE_flux graphs found
Can't check MBWPEESWGT_mixed
1 EE_cam graphs found
Can't check MBEEWPSWEPGT_cam
Can't check SIMBTWEE_met
Can't check EE_Temp
5 EE_Temp graphs found
Can't check EE_minidot
1 EE_minidot graphs found
Can't check MBSWEEWPBCBA
1 EE_processed graphs found